Statistics of oxygen consumption cases every day in the past 7 days
Scenes
A hospital has some oxygen device and wants to count the daily oxygen consumption of oxygen device in a certain department on a certain floor in the past seven days.
Prerequisites
The cumulative oxygen data of a department on a certain floor has been collected by M-IoT.
solution
Turn on the difference switch
-
In management mode, click "Develop Manage" in the left menu, click "Object Model", find the object model you created, and click the "Configure" button in the operation column of the list.

-
After clicking
Configure, find the indicator parameter in the operating parameters that needs to be configured with a difference, the cumulative amount of tumor on the third floor, Only the indicator parameters in the operating parameters can be configured with a difference.
After configuring the difference, the difference is only effective for the current time and the following time, and is not effective for the previous time.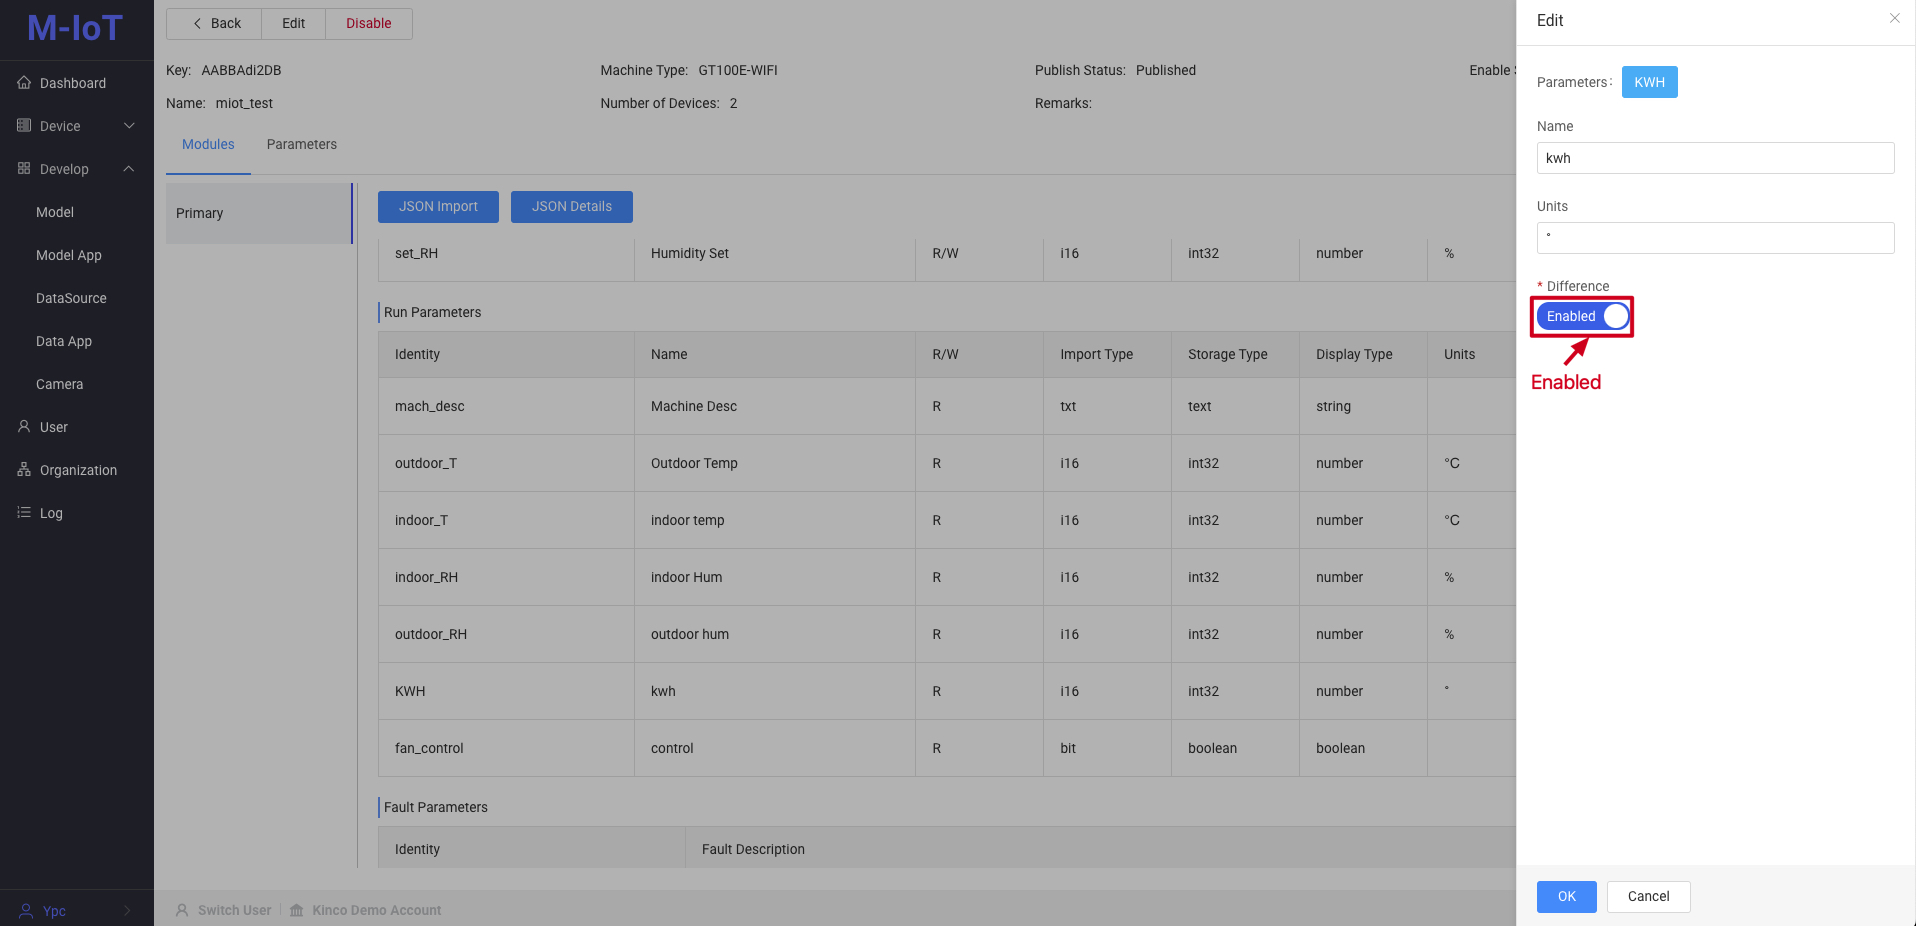
Configure a statistical method for the daily oxygen consumption of a department in a certain building of a hospital in the past 7 days
When the current time is between 0:00 and 24:00, the final value of the day will change, and it will be counted every 5 minutes.Method 1: Directly count by difference.
Method 2: Count by the difference between the final value and the initial value of each day.
The definition of difference is shown in the following table
| Time | Cumulative amount of tumor on the 3rd floor | Difference |
|---|---|---|
| 2024-03-03 | 1227 | 2 |
| 2024-03-02 | 1225 | 2 |
| 2024-03-01 | 1223 | 2 |
| 2024-02-29 | 1221 | 0 |
The difference between 2024-03-03 and 2024-02-29 is: 1227 - 1221 = 6
- In management mode, click "Data Source" under Develop Manage in the left menu, open the "Data Source" page, switch to "Kanban Data Source", click the "New" button to create a new data source
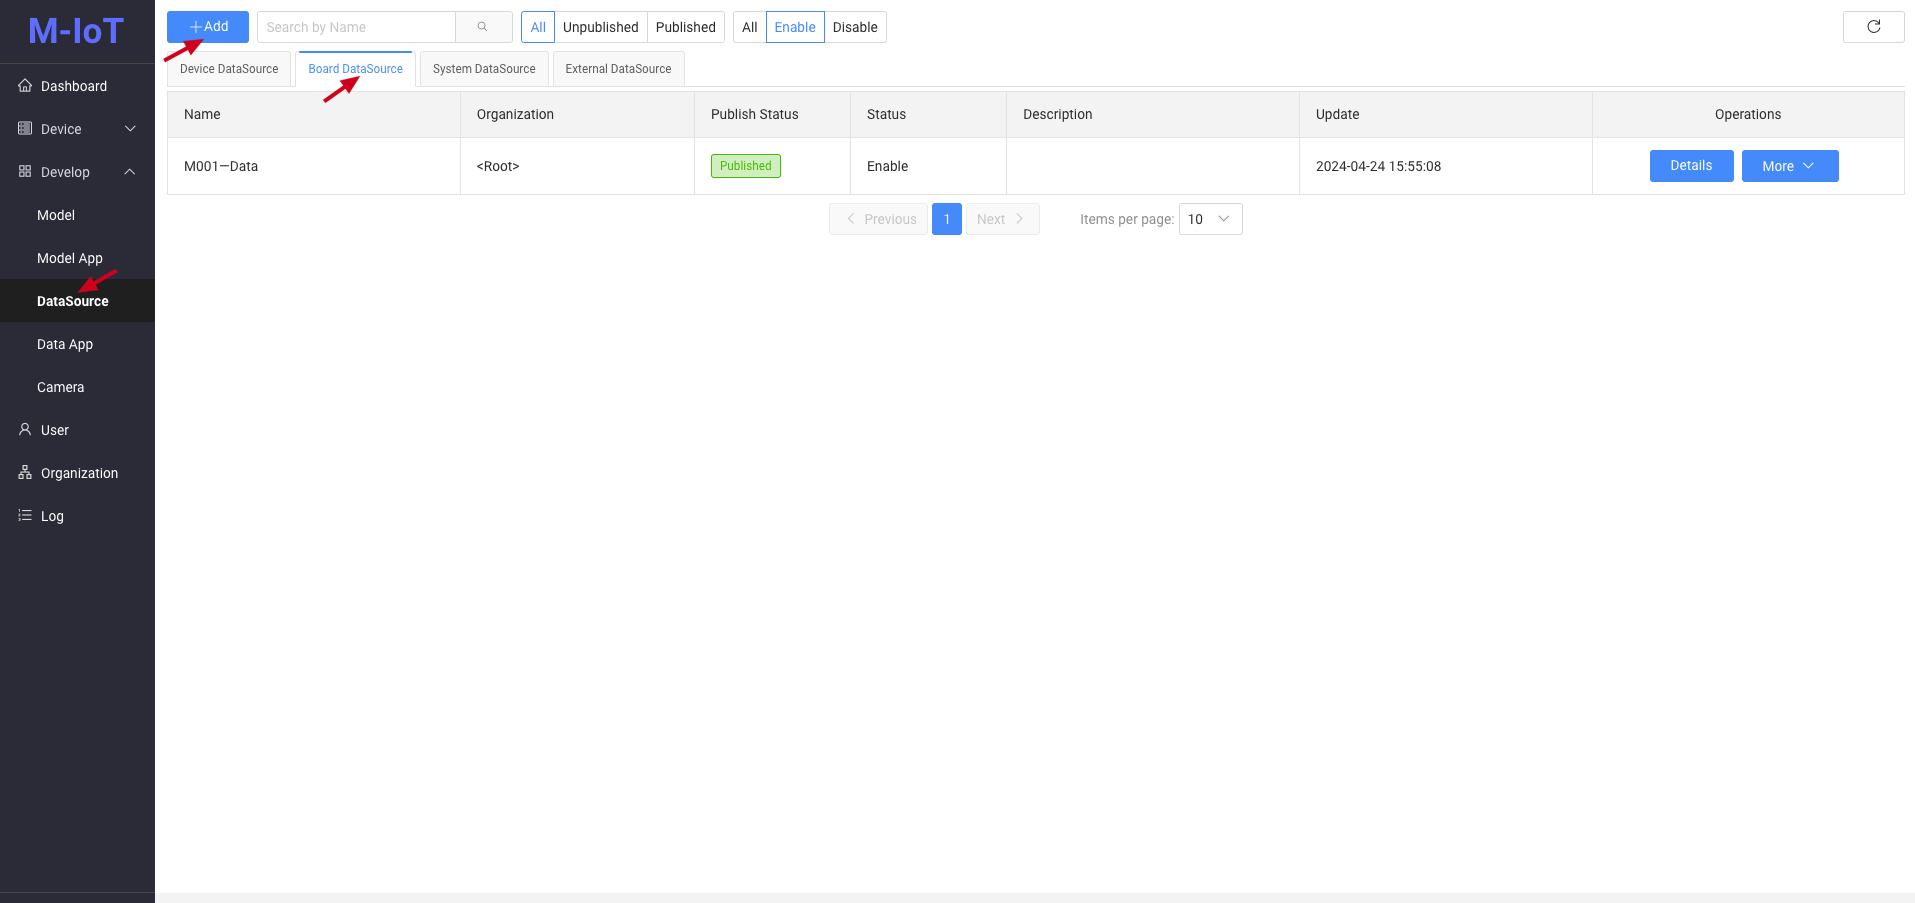
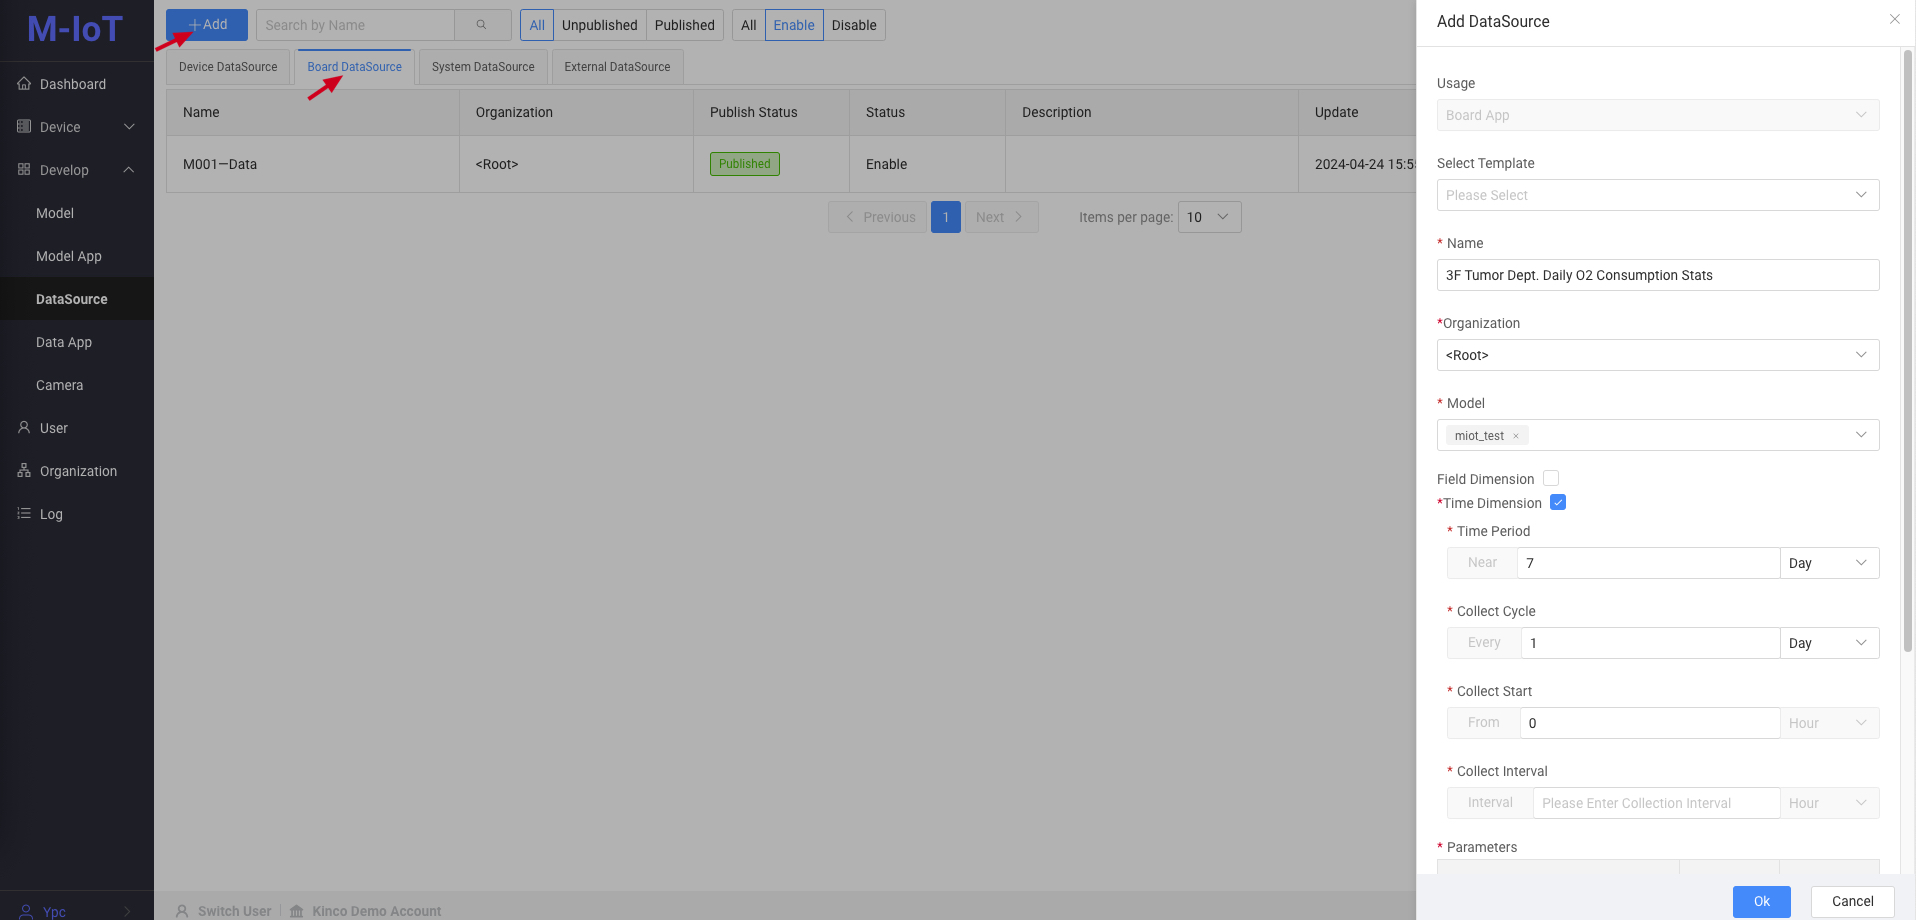

- Time dimension: Click the radio button after the time dimension to pop up the time dimension parameters
- Time period: Statistics for the past 7 days
- Collection cycle: once a day
- Collection start and collection interval: Count oxygen consumption from 0:00 to 24:00 every day. Fill in according to the actual situation. For example, if the effective statistical time is from 8:00 am to 18:00 pm every day, fill in 8 and 10 respectively.
- Parameters: Click the Add Parameter button to add three parameters, namely:
- Cumulative amount (difference) of tumor on the third floor, summed by aggregation method.
- Tumor 3rd floor cumulative amount, initial value of aggregation method.
- Cumulative volume of tumor on the third floor, final value of aggregation method.
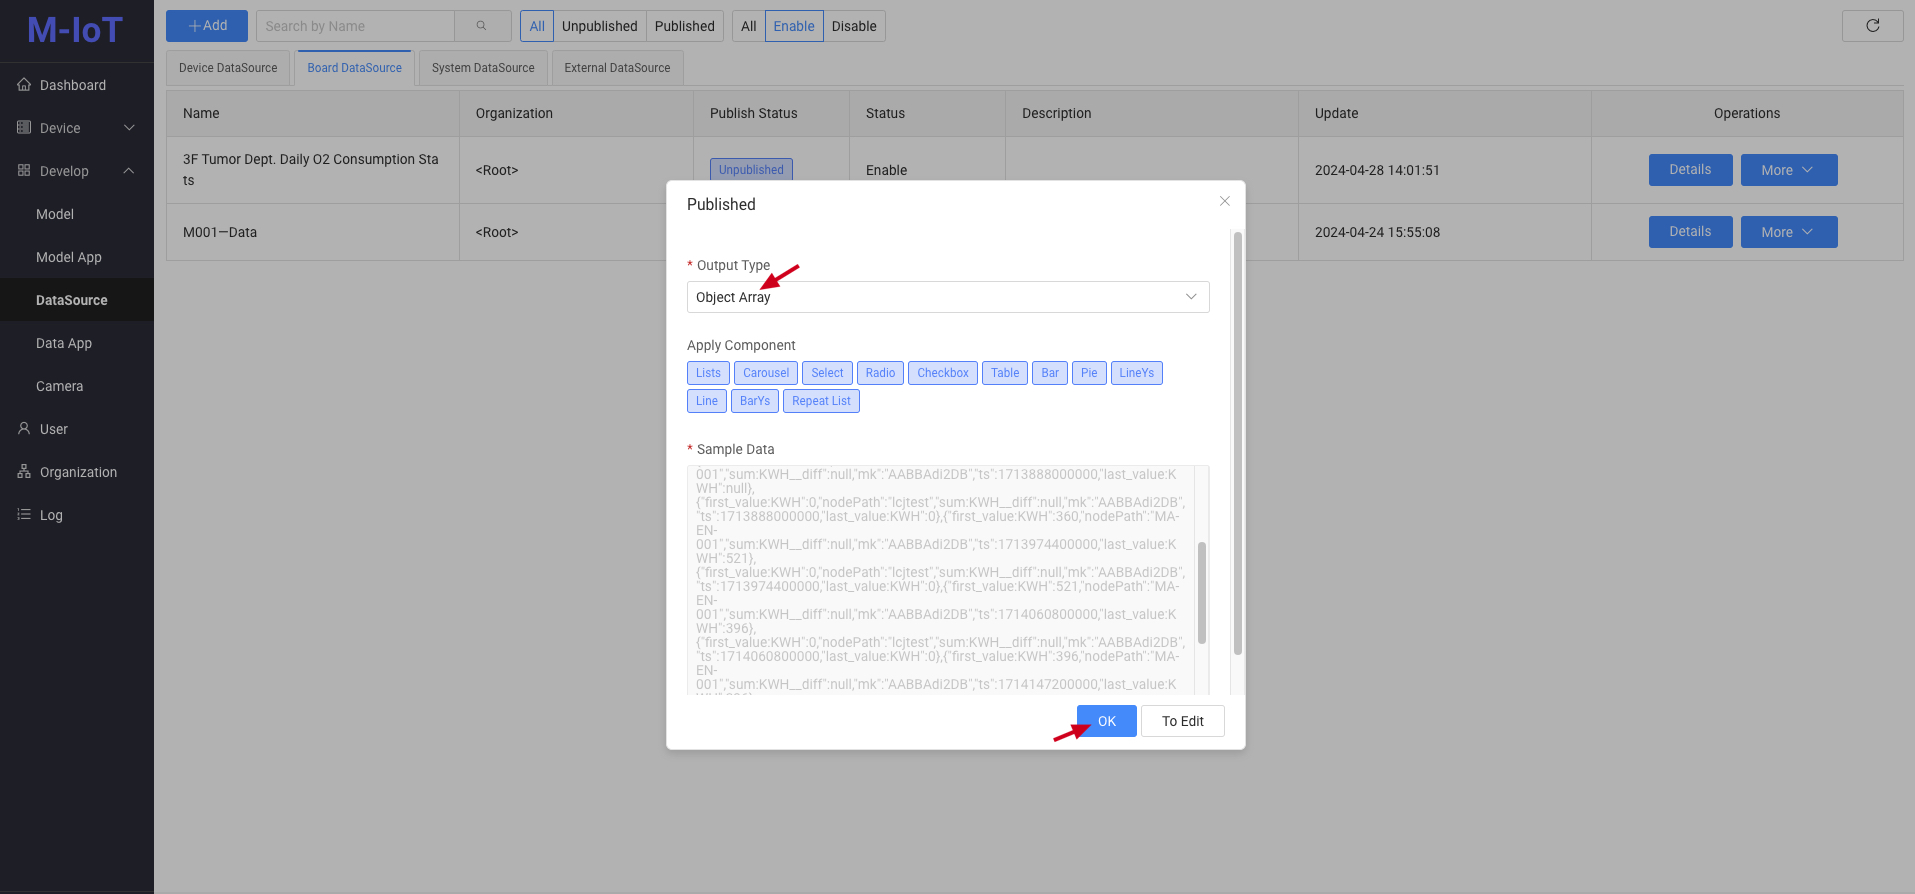
After filling in the information, click the Save button to save the data source.
Generate reports
- In management mode, click Data Application under Develop Manage on the left menu, open Data Application, switch to Dashboard Page, and create a new Data Application.

After filling in the form, click OK to save the application.
-
Go back to the
Data Applicationlist, click theDesignbutton in the operation bar to enter the DV screen. Find the table component under the chart component, click the mouse and drag it into the middle editing window. Select the dragged table, under the style in the operation area on the right, click Configure Data Source under Private Properties, and configureData Source.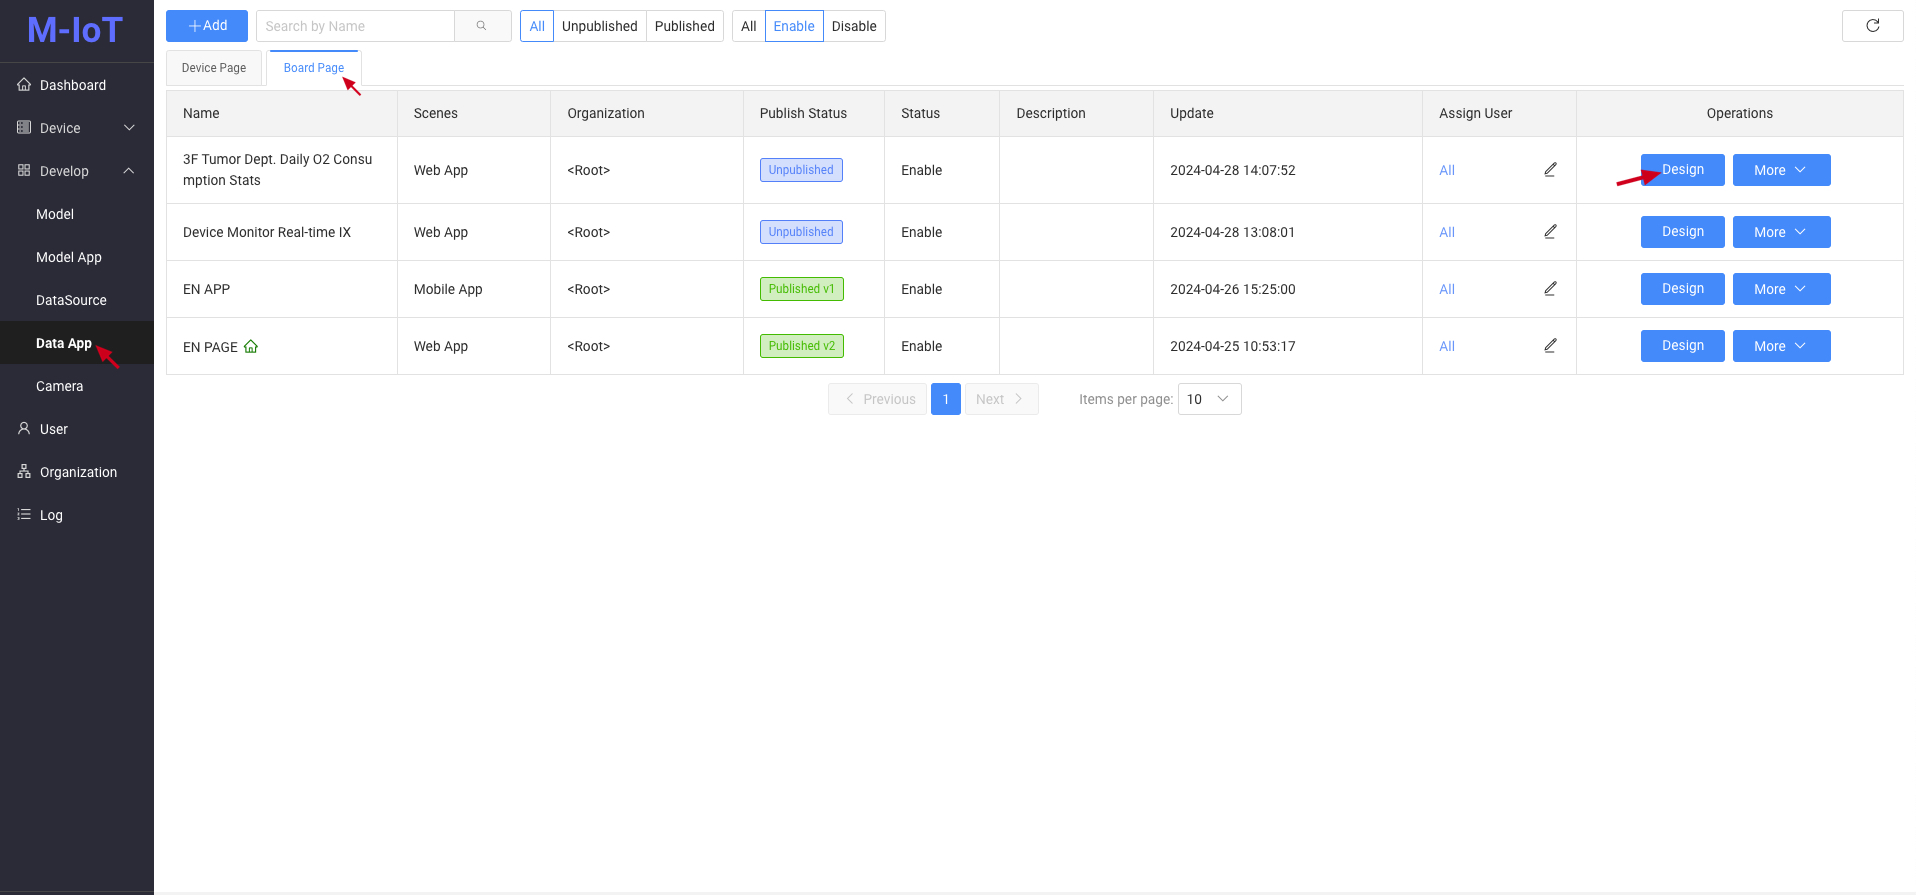
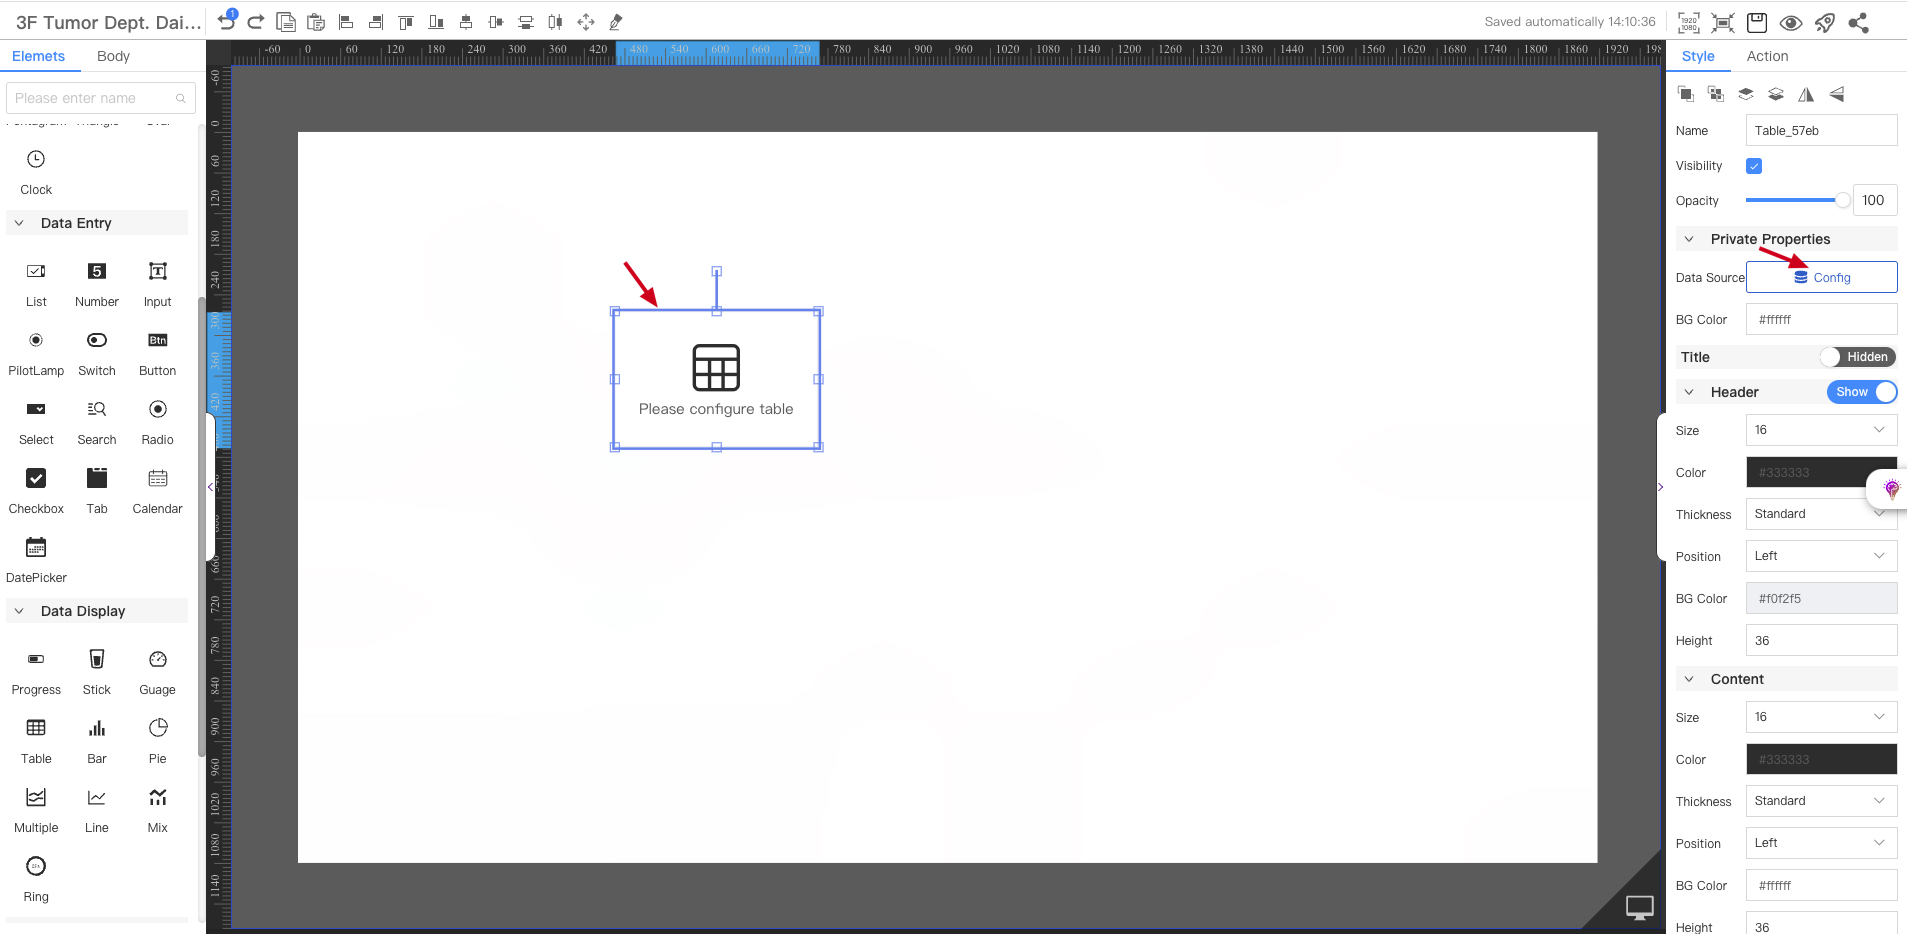
-
After clicking Configure Data Source, select Interface, Customize, and select the data source we created, "3-layer Tumor Department Daily Oxygen Consumption Statistics" in the Select Data Source drop-down box.
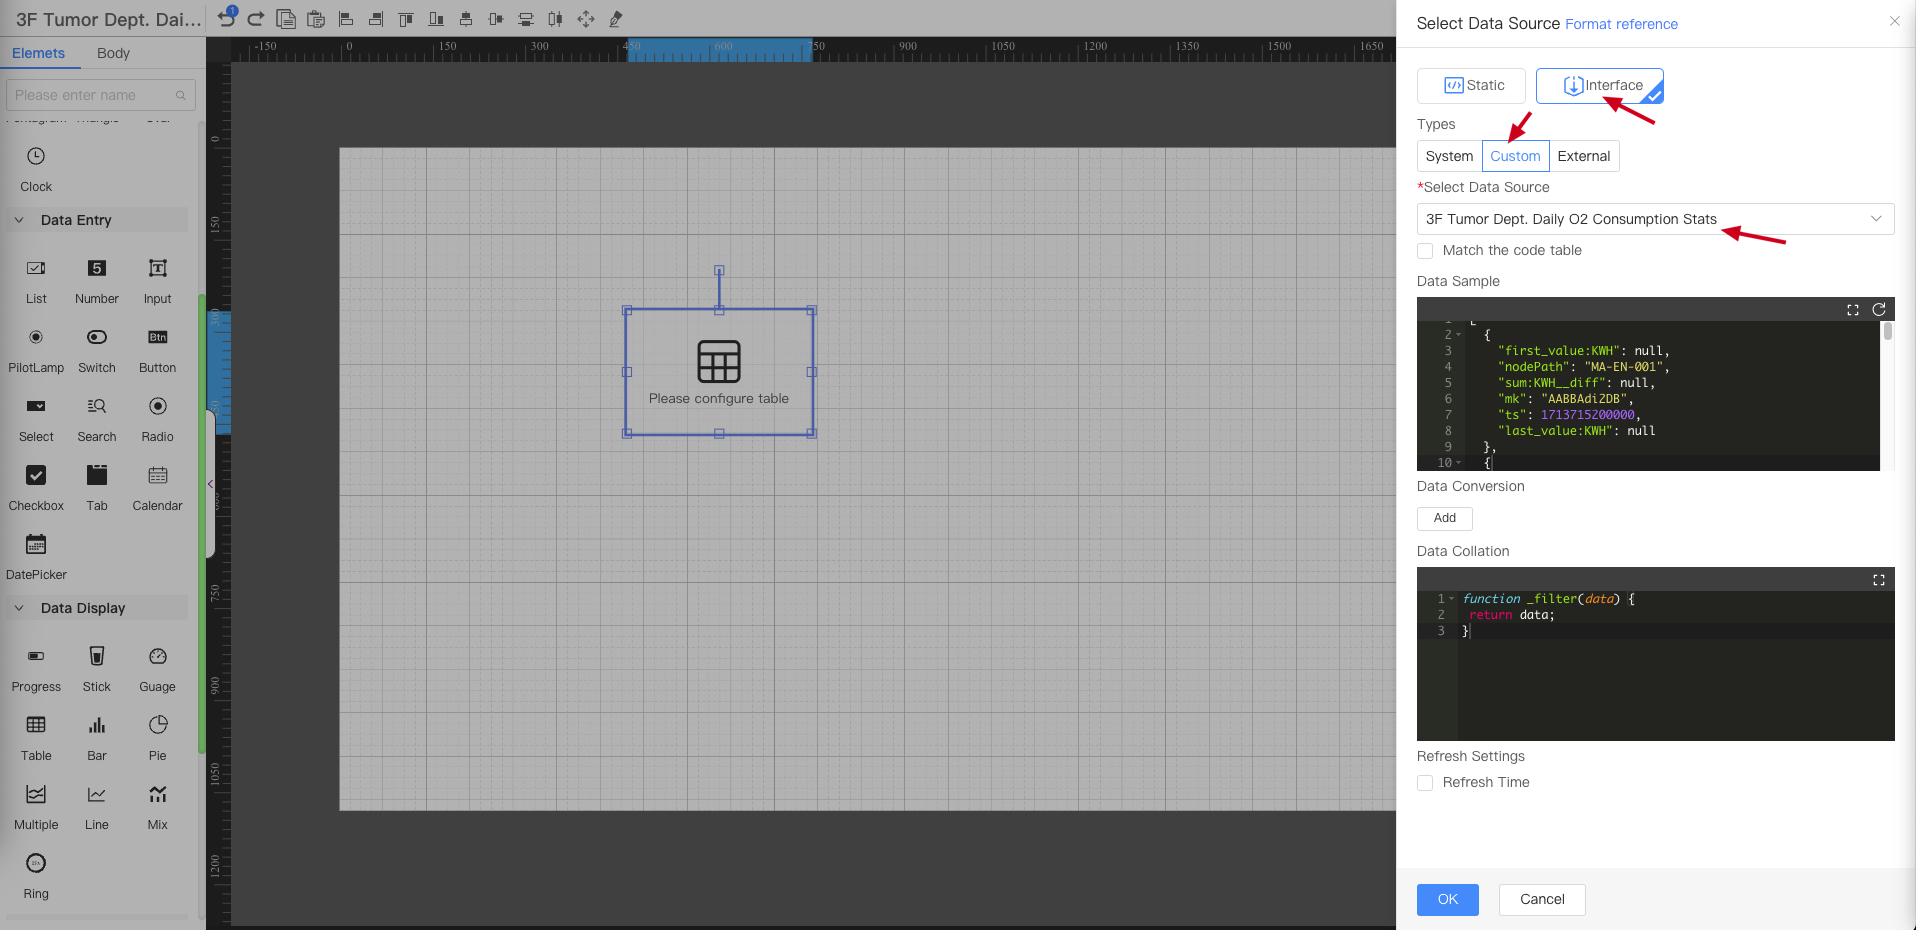
-
Click the Add button, and format the time data, oxygen consumption indicator.
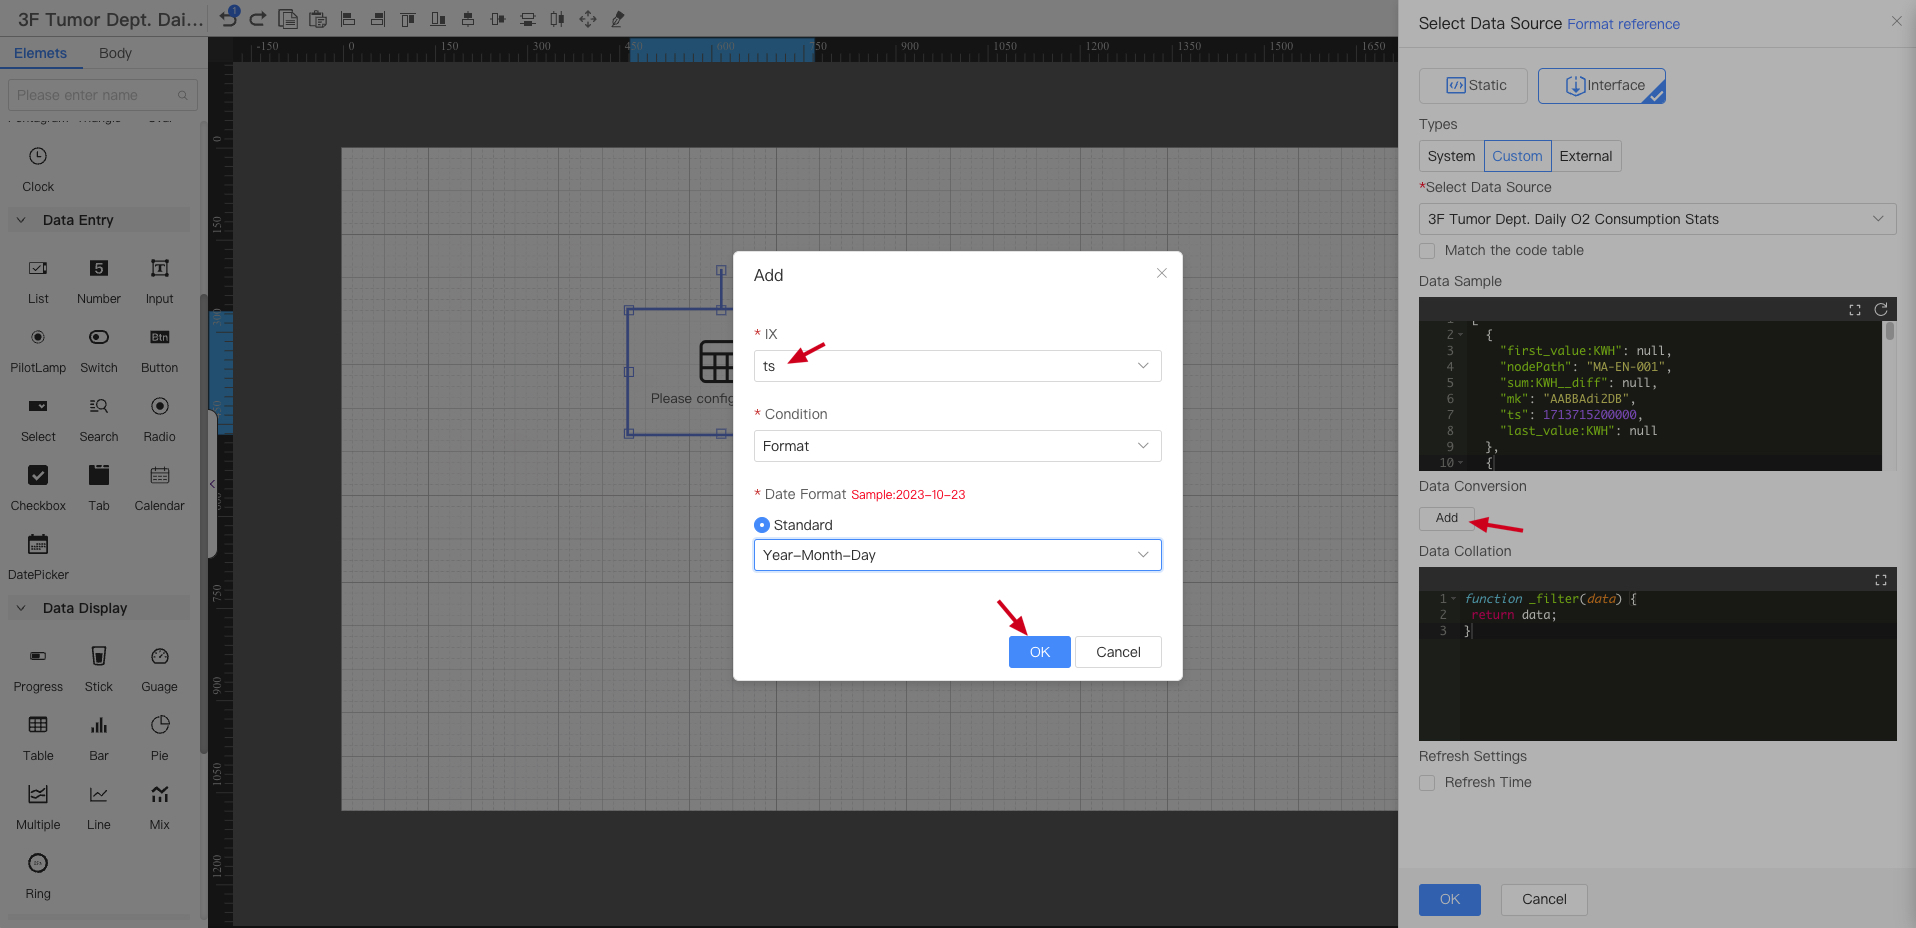
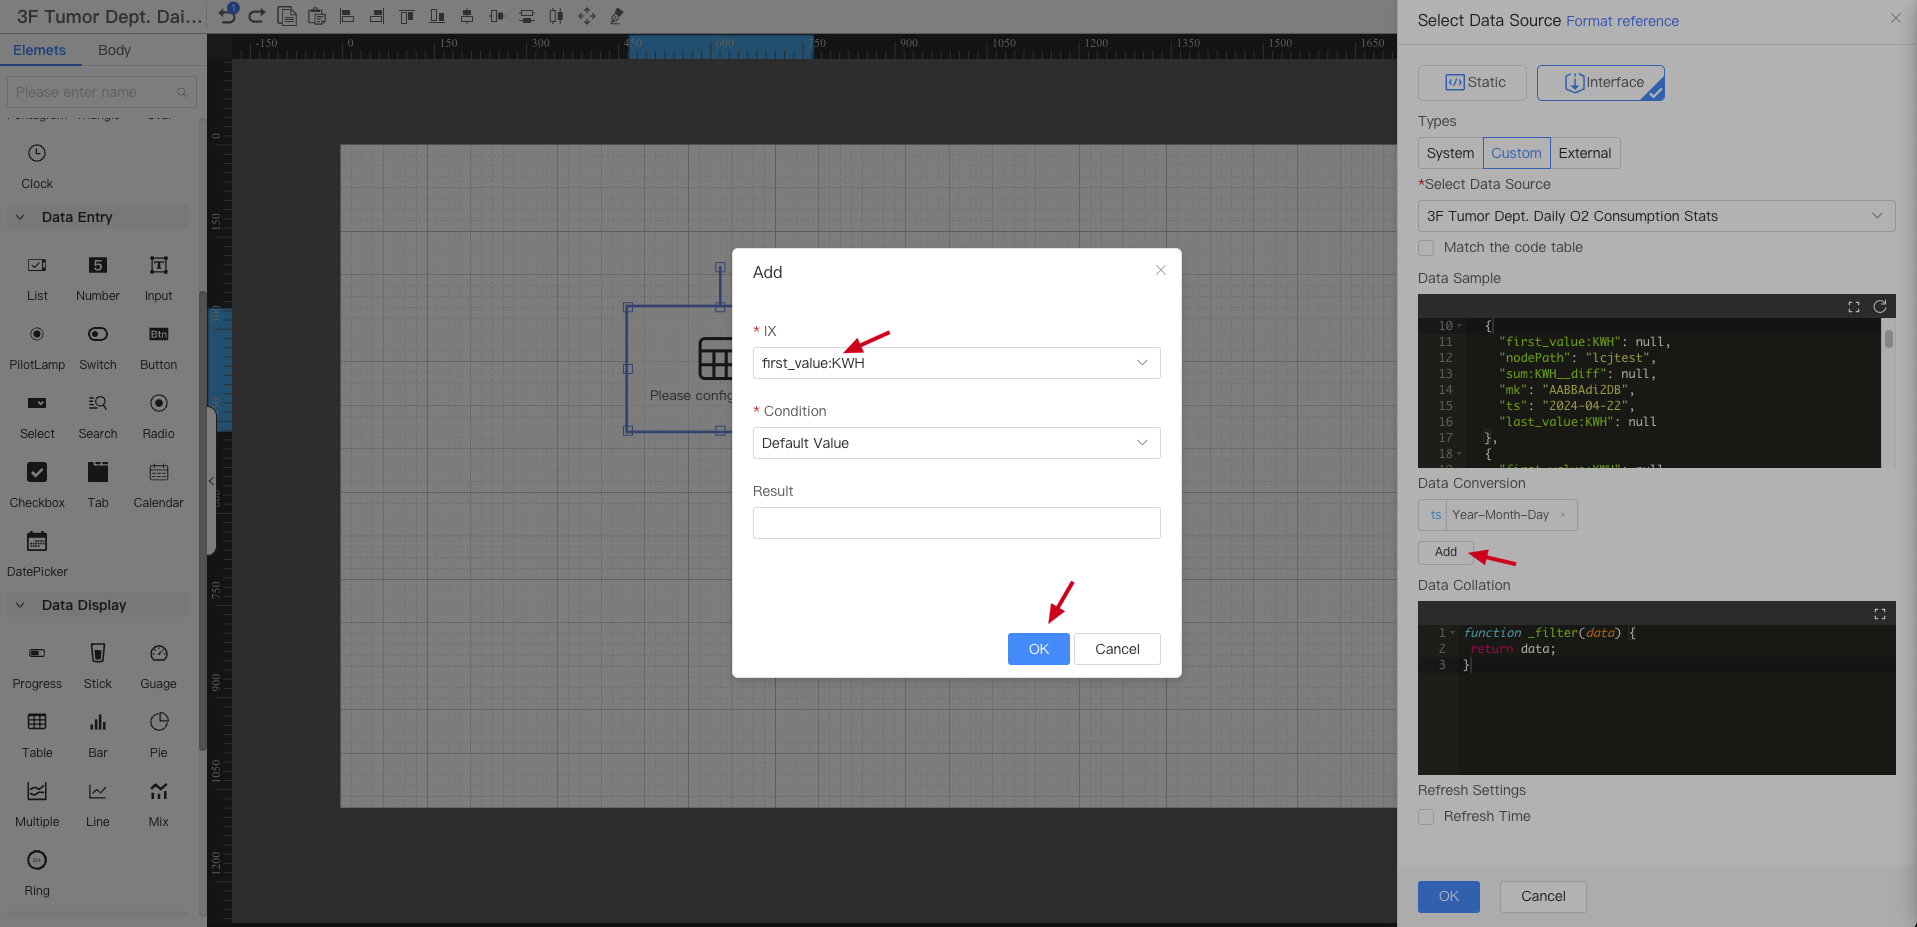
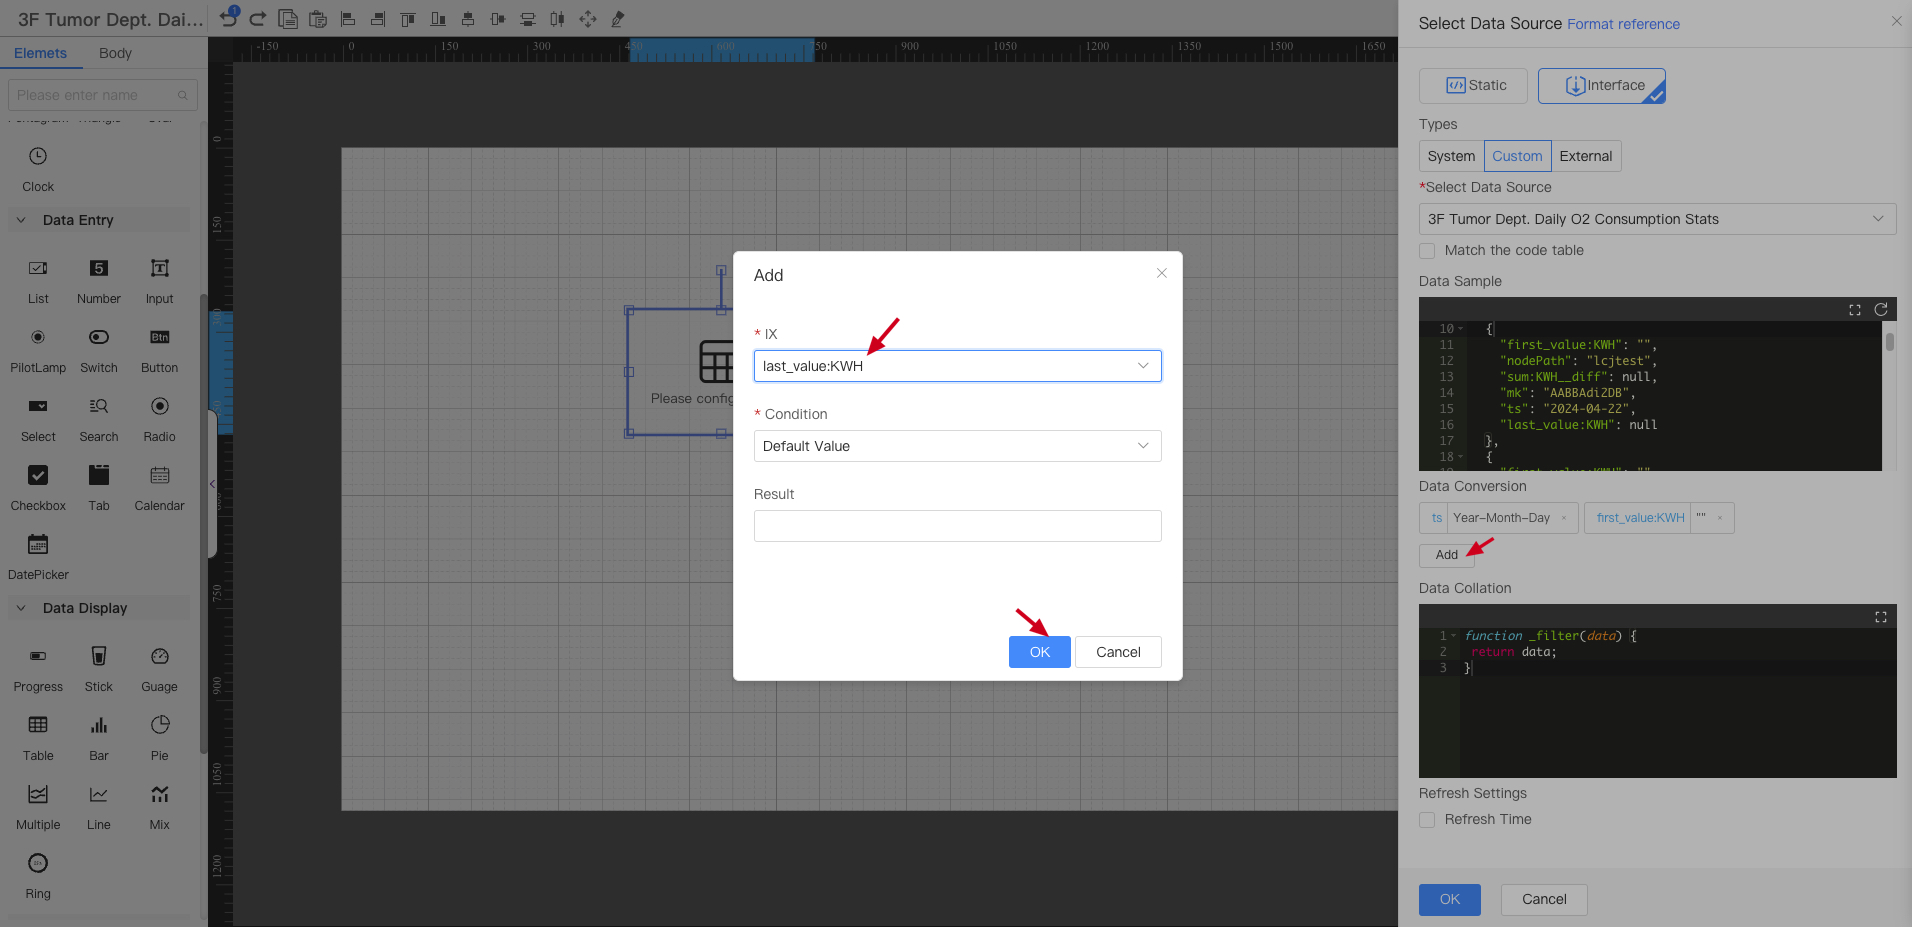


Time formatting: can only format parameters with ts parameters
After configuration, click the OK button to save.
-
Click to select the completed table, in the right operation bar, delete the fields that do not need to be displayed, and edit the table header
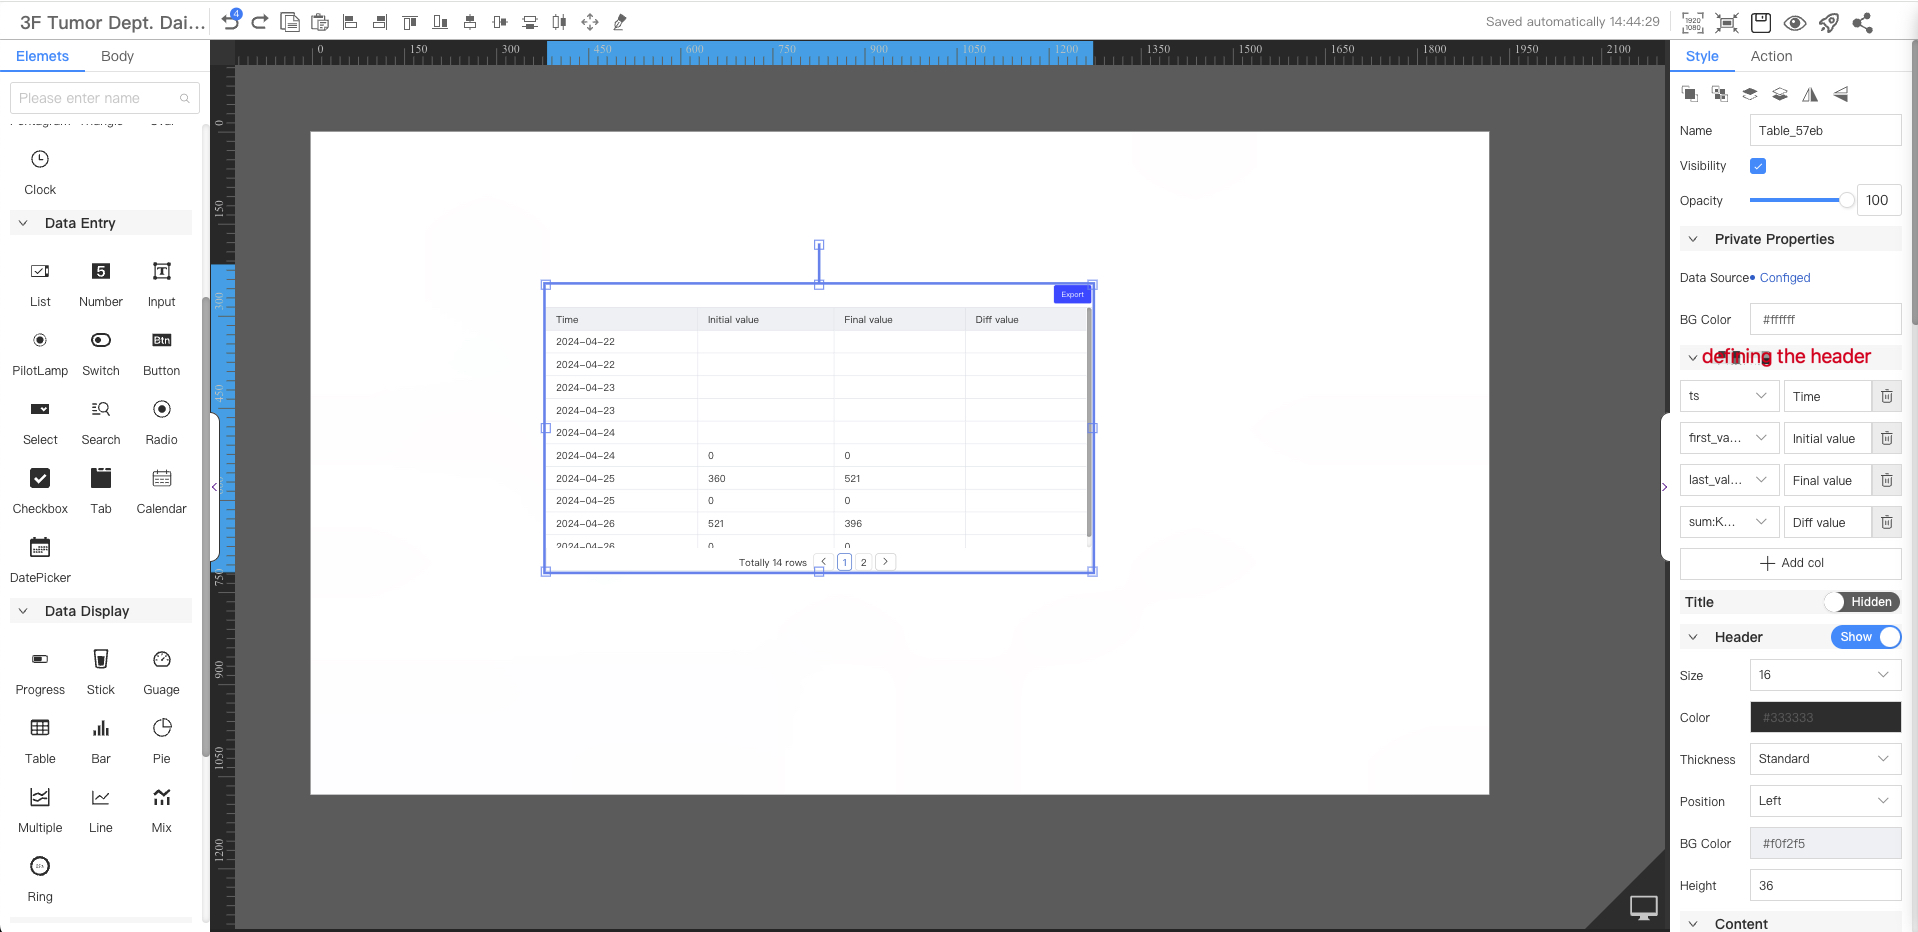
⚠️ Due to the difference configured on 2024-02-28, there is no difference data before the 28th, and the difference calculation on the 28th will have errors.
-
If you need to export, turn on the export switch in the right operation bar and add an export button
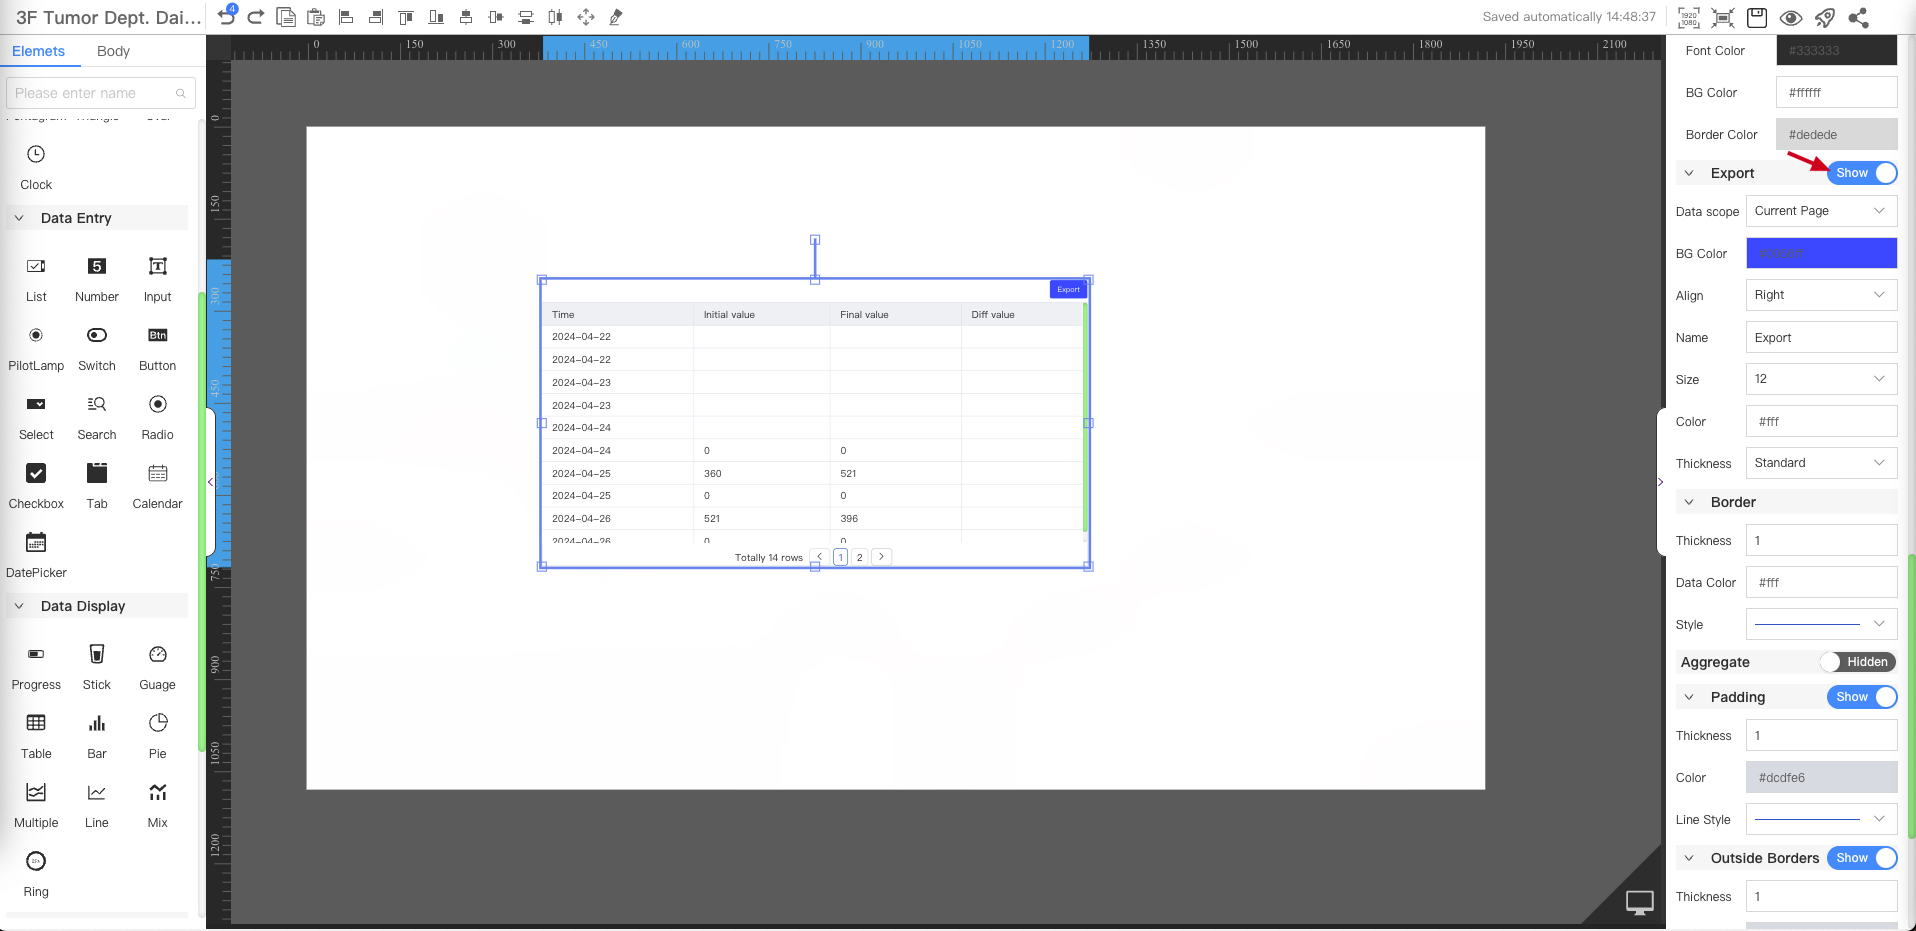
⚠️ Currently, the exported ts indicator cannot be formatted directly when exported. Please use the =TEXT((A1/1000+83600)/86400+70365+19,"yyyy-mm-dd") function to format the time in Excel by yourself (A1 represents the grid of the timestamp).