Device Monitor and Statistics Case
Scenes
This case mainly introduces functions such as monitoring device status, viewing device data in real time, issuing device parameters, and collecting device data.
Premise
Before starting the configuration, make sure that the following conditions are met:
- Device data has been collected in real time on the M-IoT platform;
- The data app has been created on the M-IoT platform (device page);
Configuration Overview
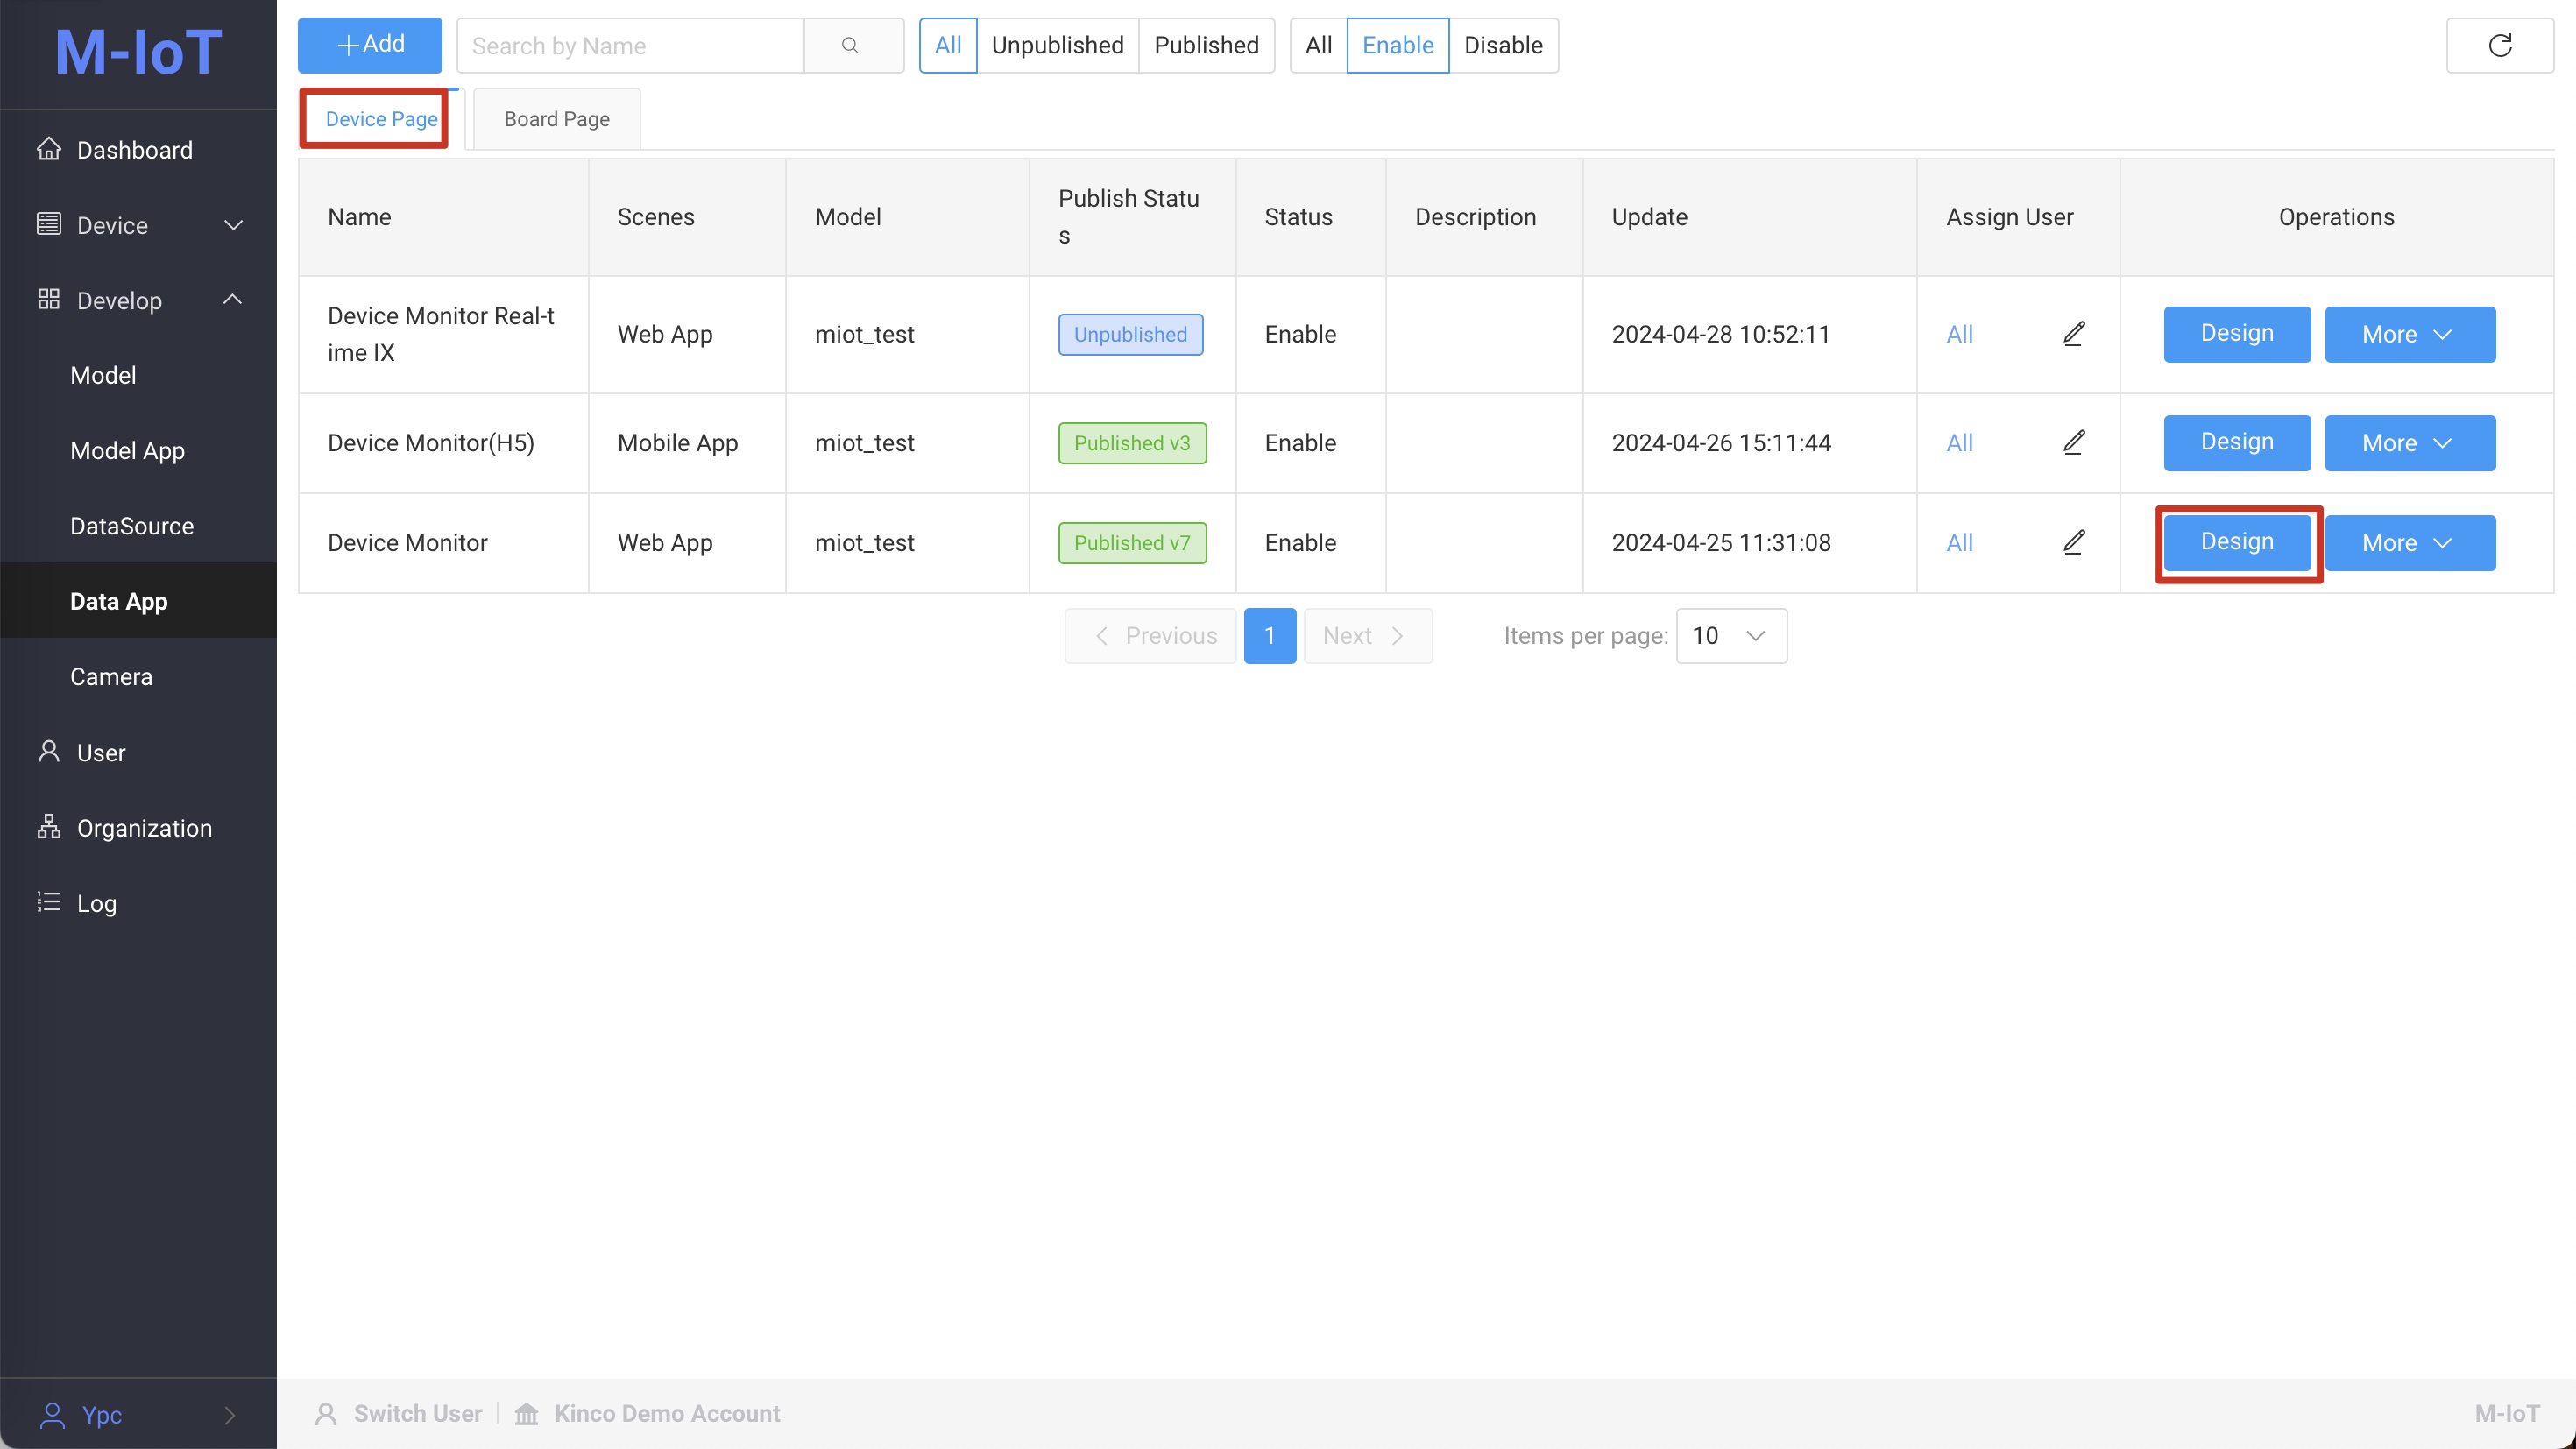
⚠️Important NotesIn management mode, click
Data Appunder Development Management in the left menu, and clickDesignin theOperationcolumn of theData Applist to enter the visual configuration interface and configure the components.
This case study will configure the following six functional modules step by step. The text labels, positions, and styles (such as color and size) of all components can be flexibly adjusted in the style panel of each component according to actual needs.:
Display device connection statusDisplay device operating statusDisplay device temperatureIssue device parametersDisplay the average temperature and humidity for the past 7 daysDisplay the highest and lowest temperature and humidity for the past 7 days
Select Device Page and click Design to enter the visual config interface.
1. Display device connection status
-
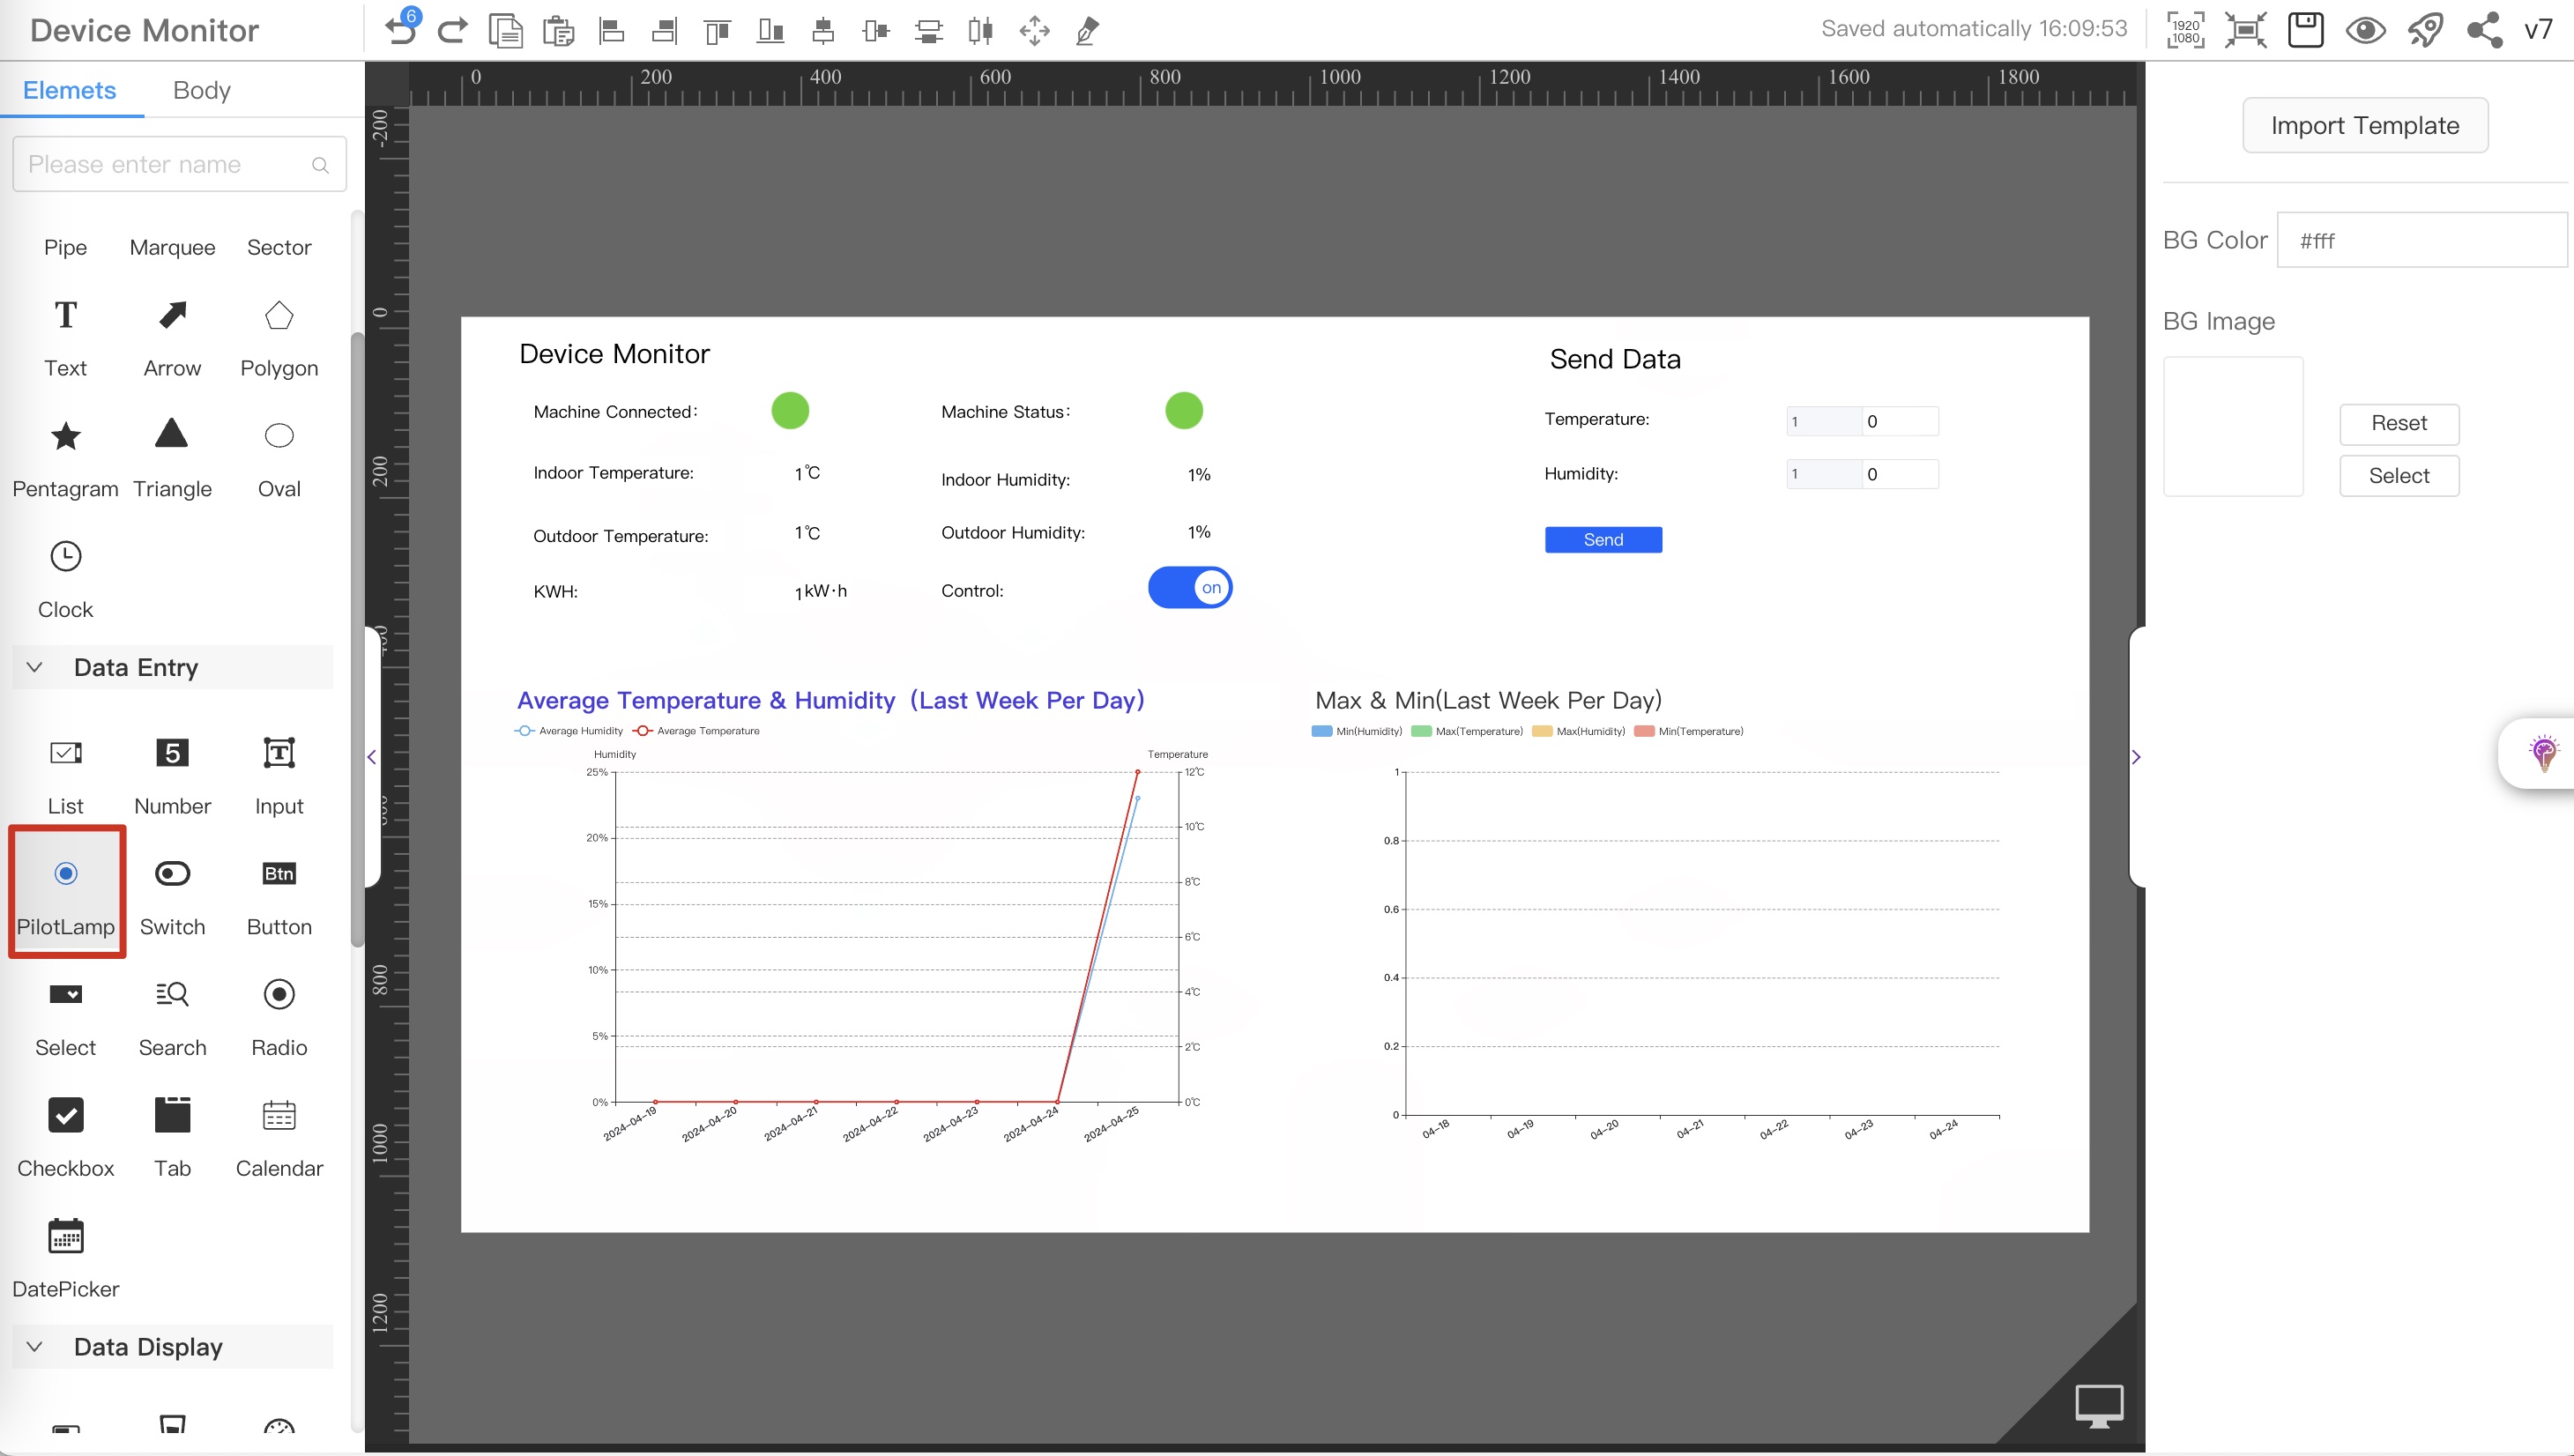
From the component library on the left, select the PilotLamp component and drag it onto the canvas.
-
Select the dragged component, in the style
Data Sourceconfiguration item on the right, click the icon next to it to configure the data source.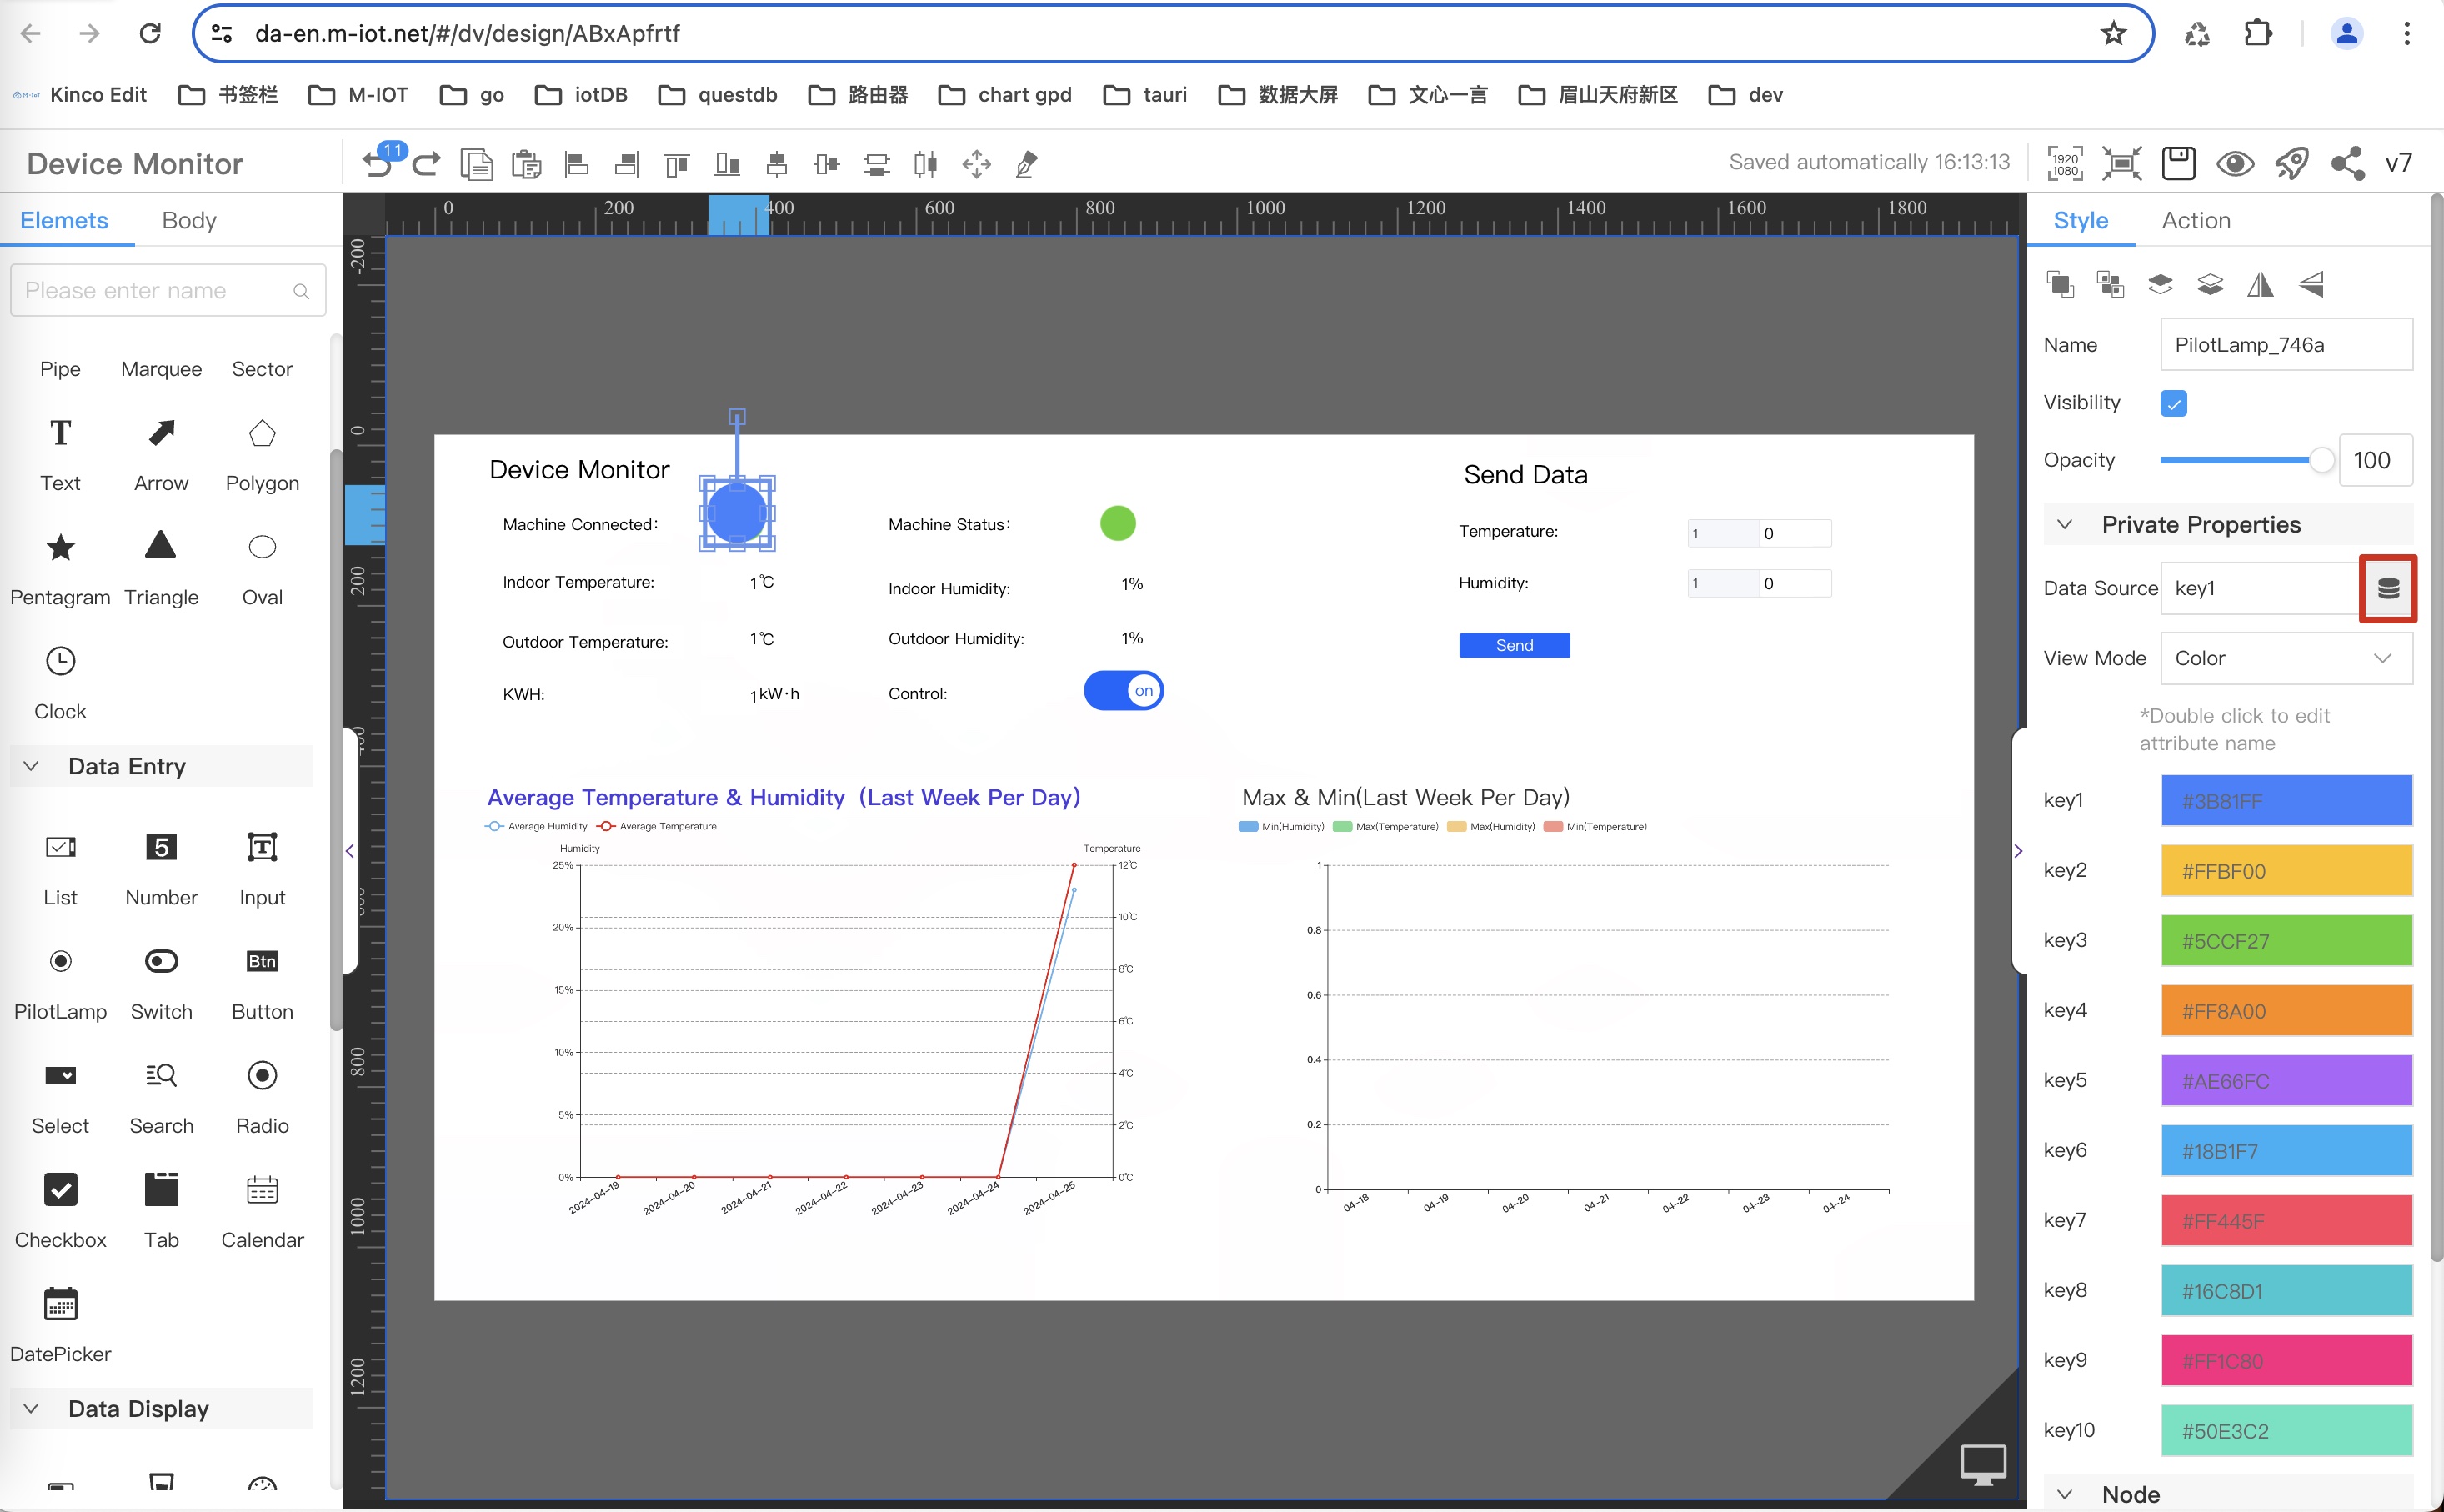
-
Configure the corresponding color according to the result returned by the interface
-
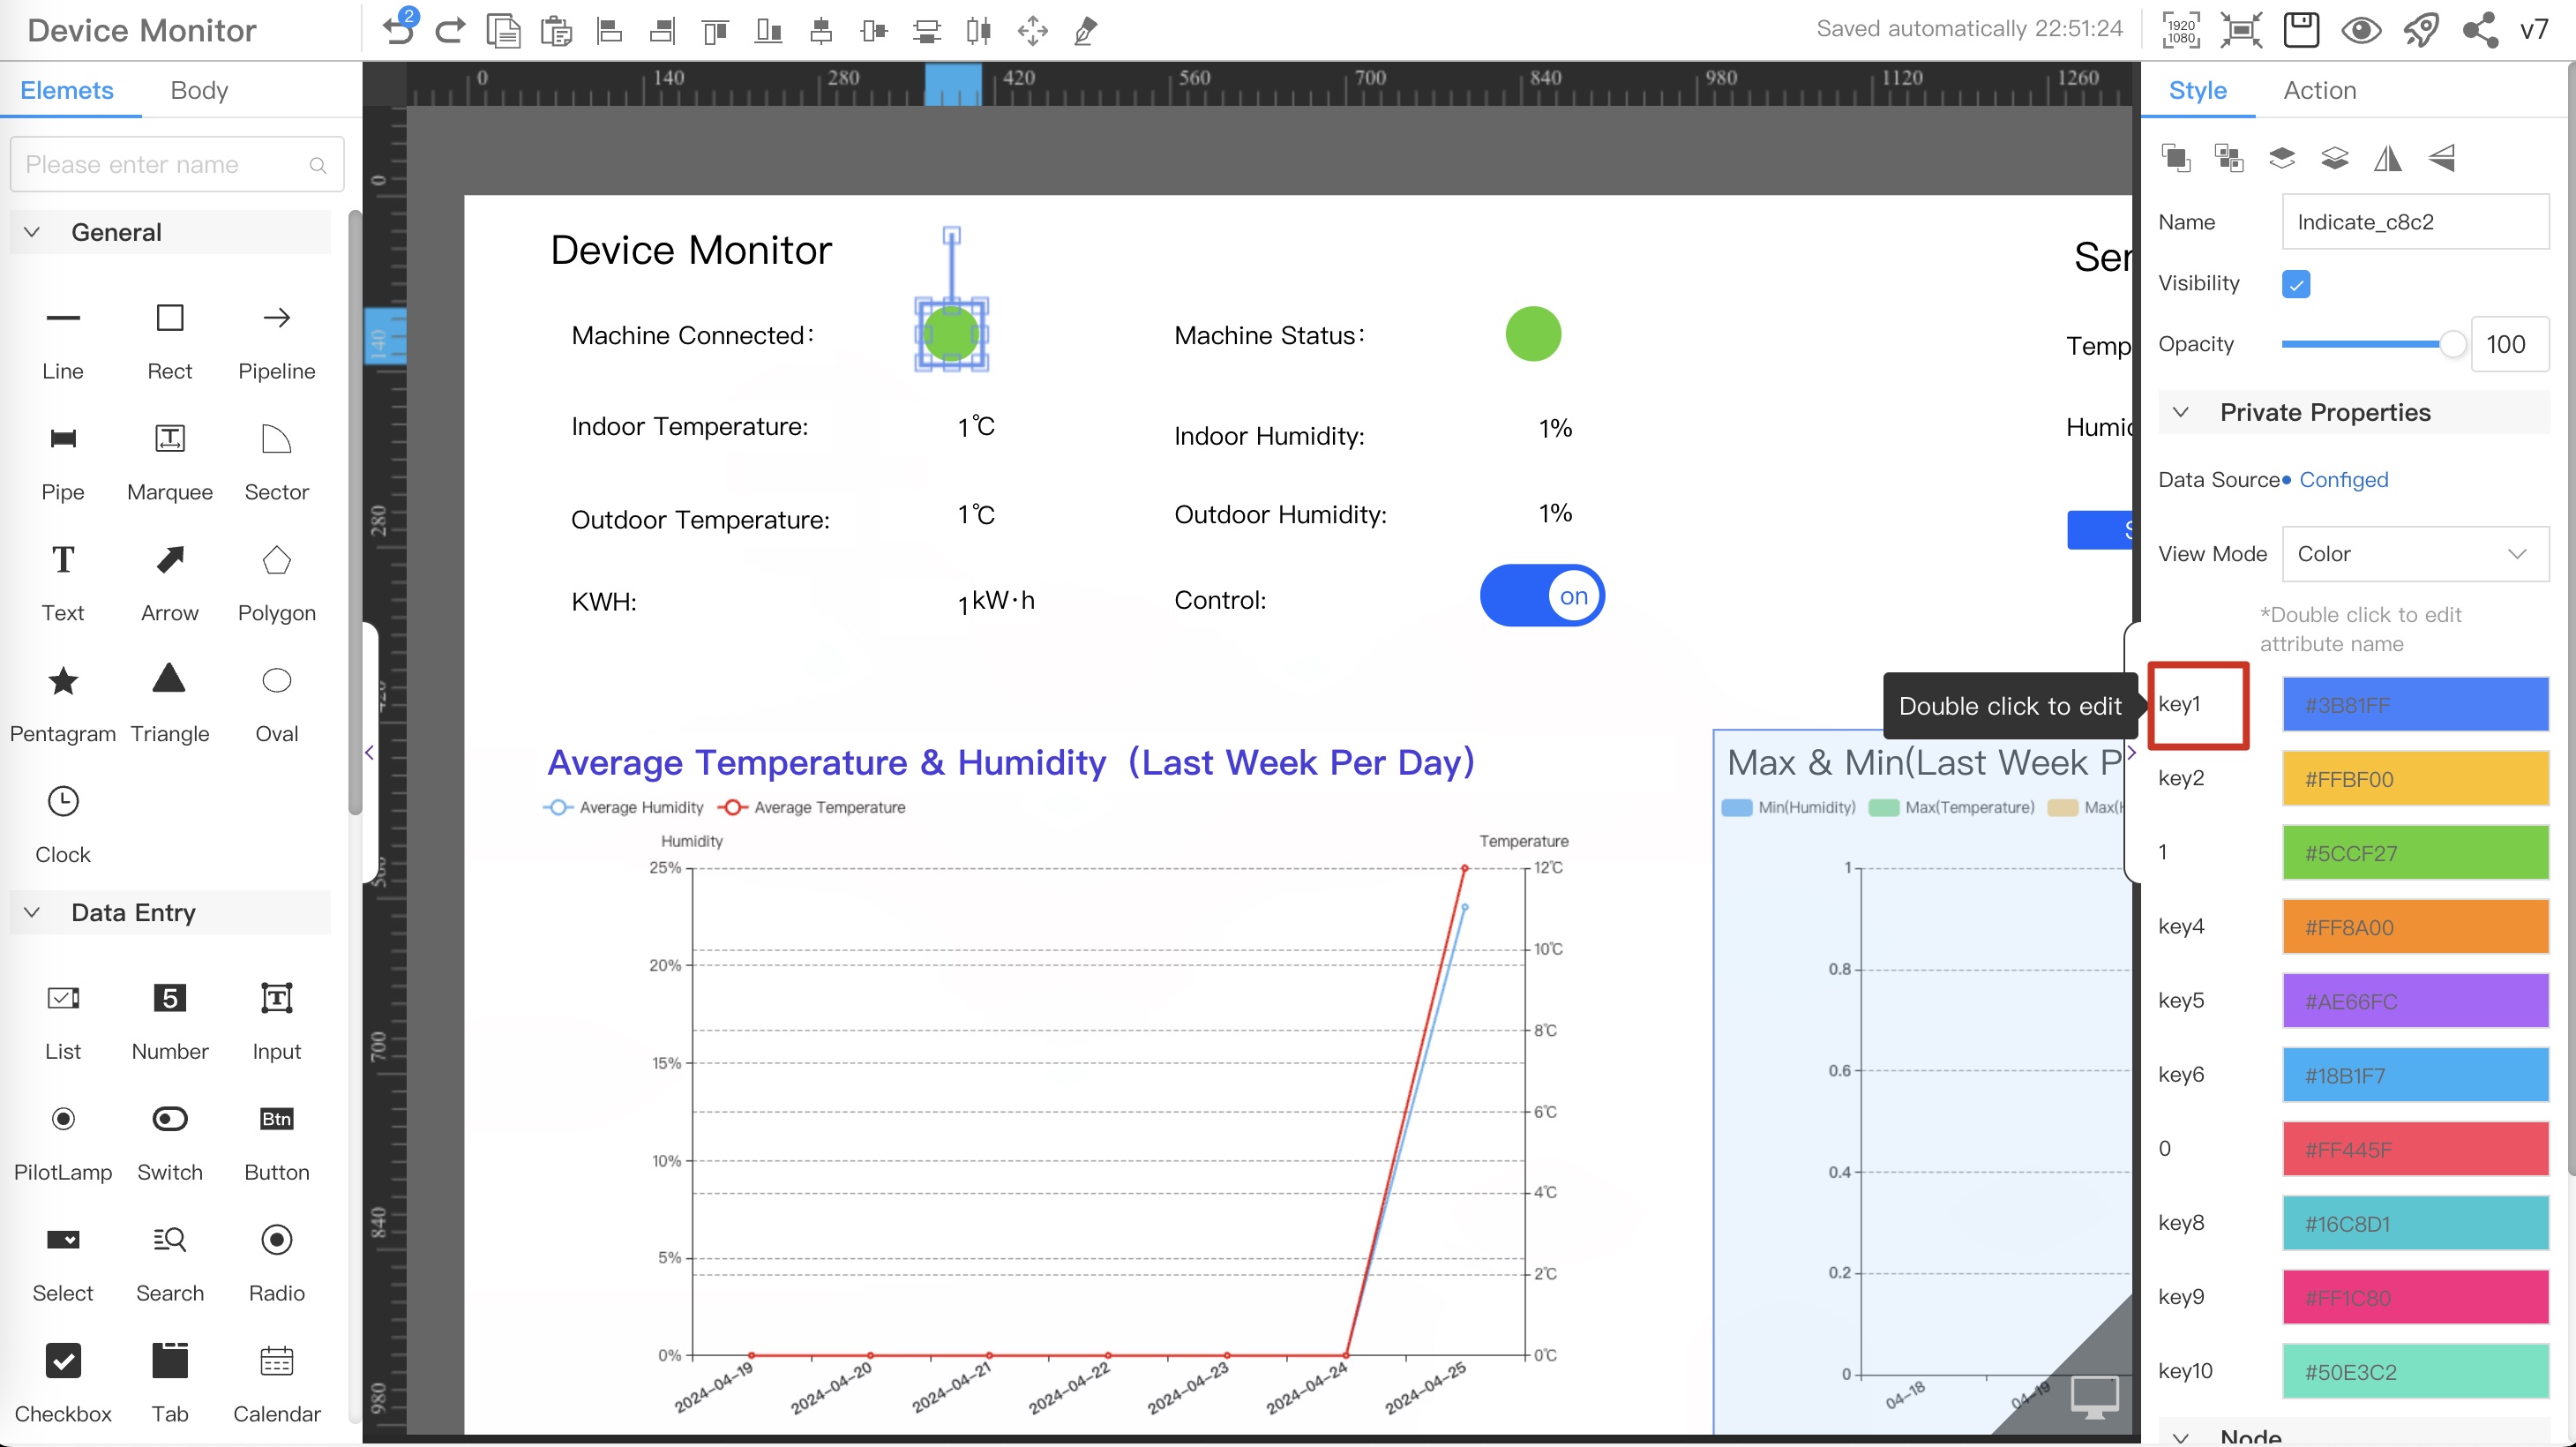
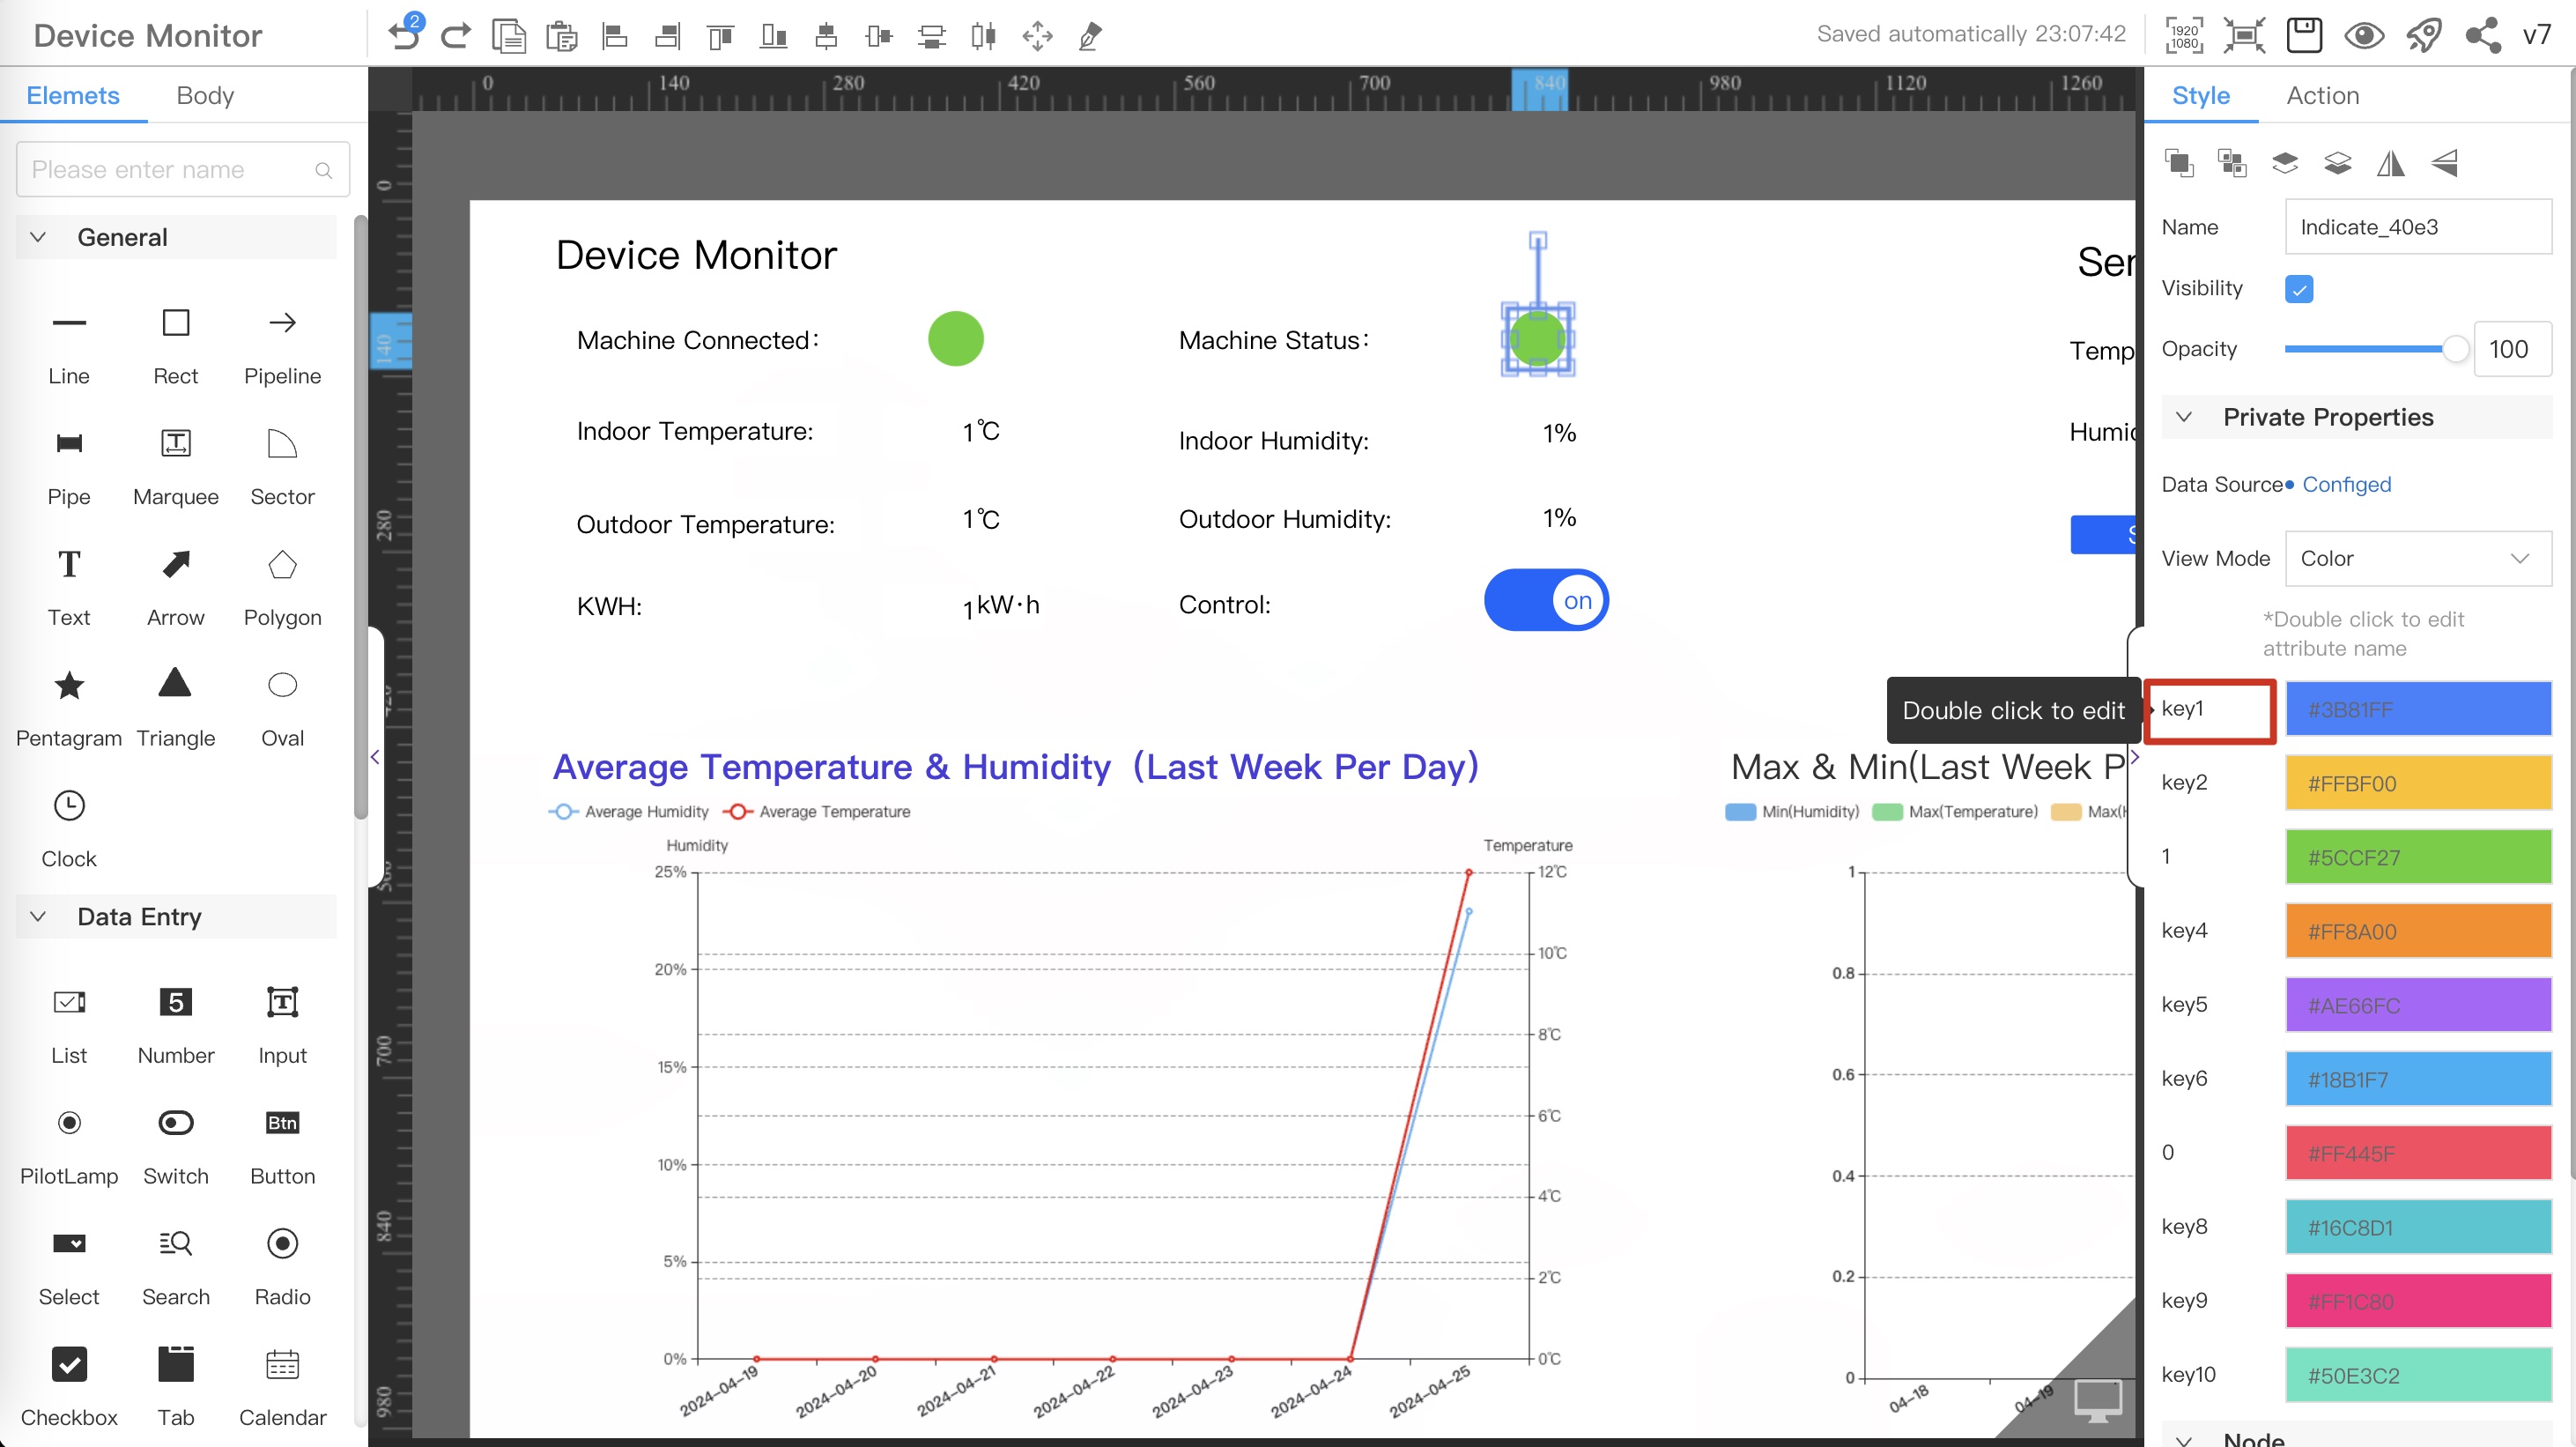
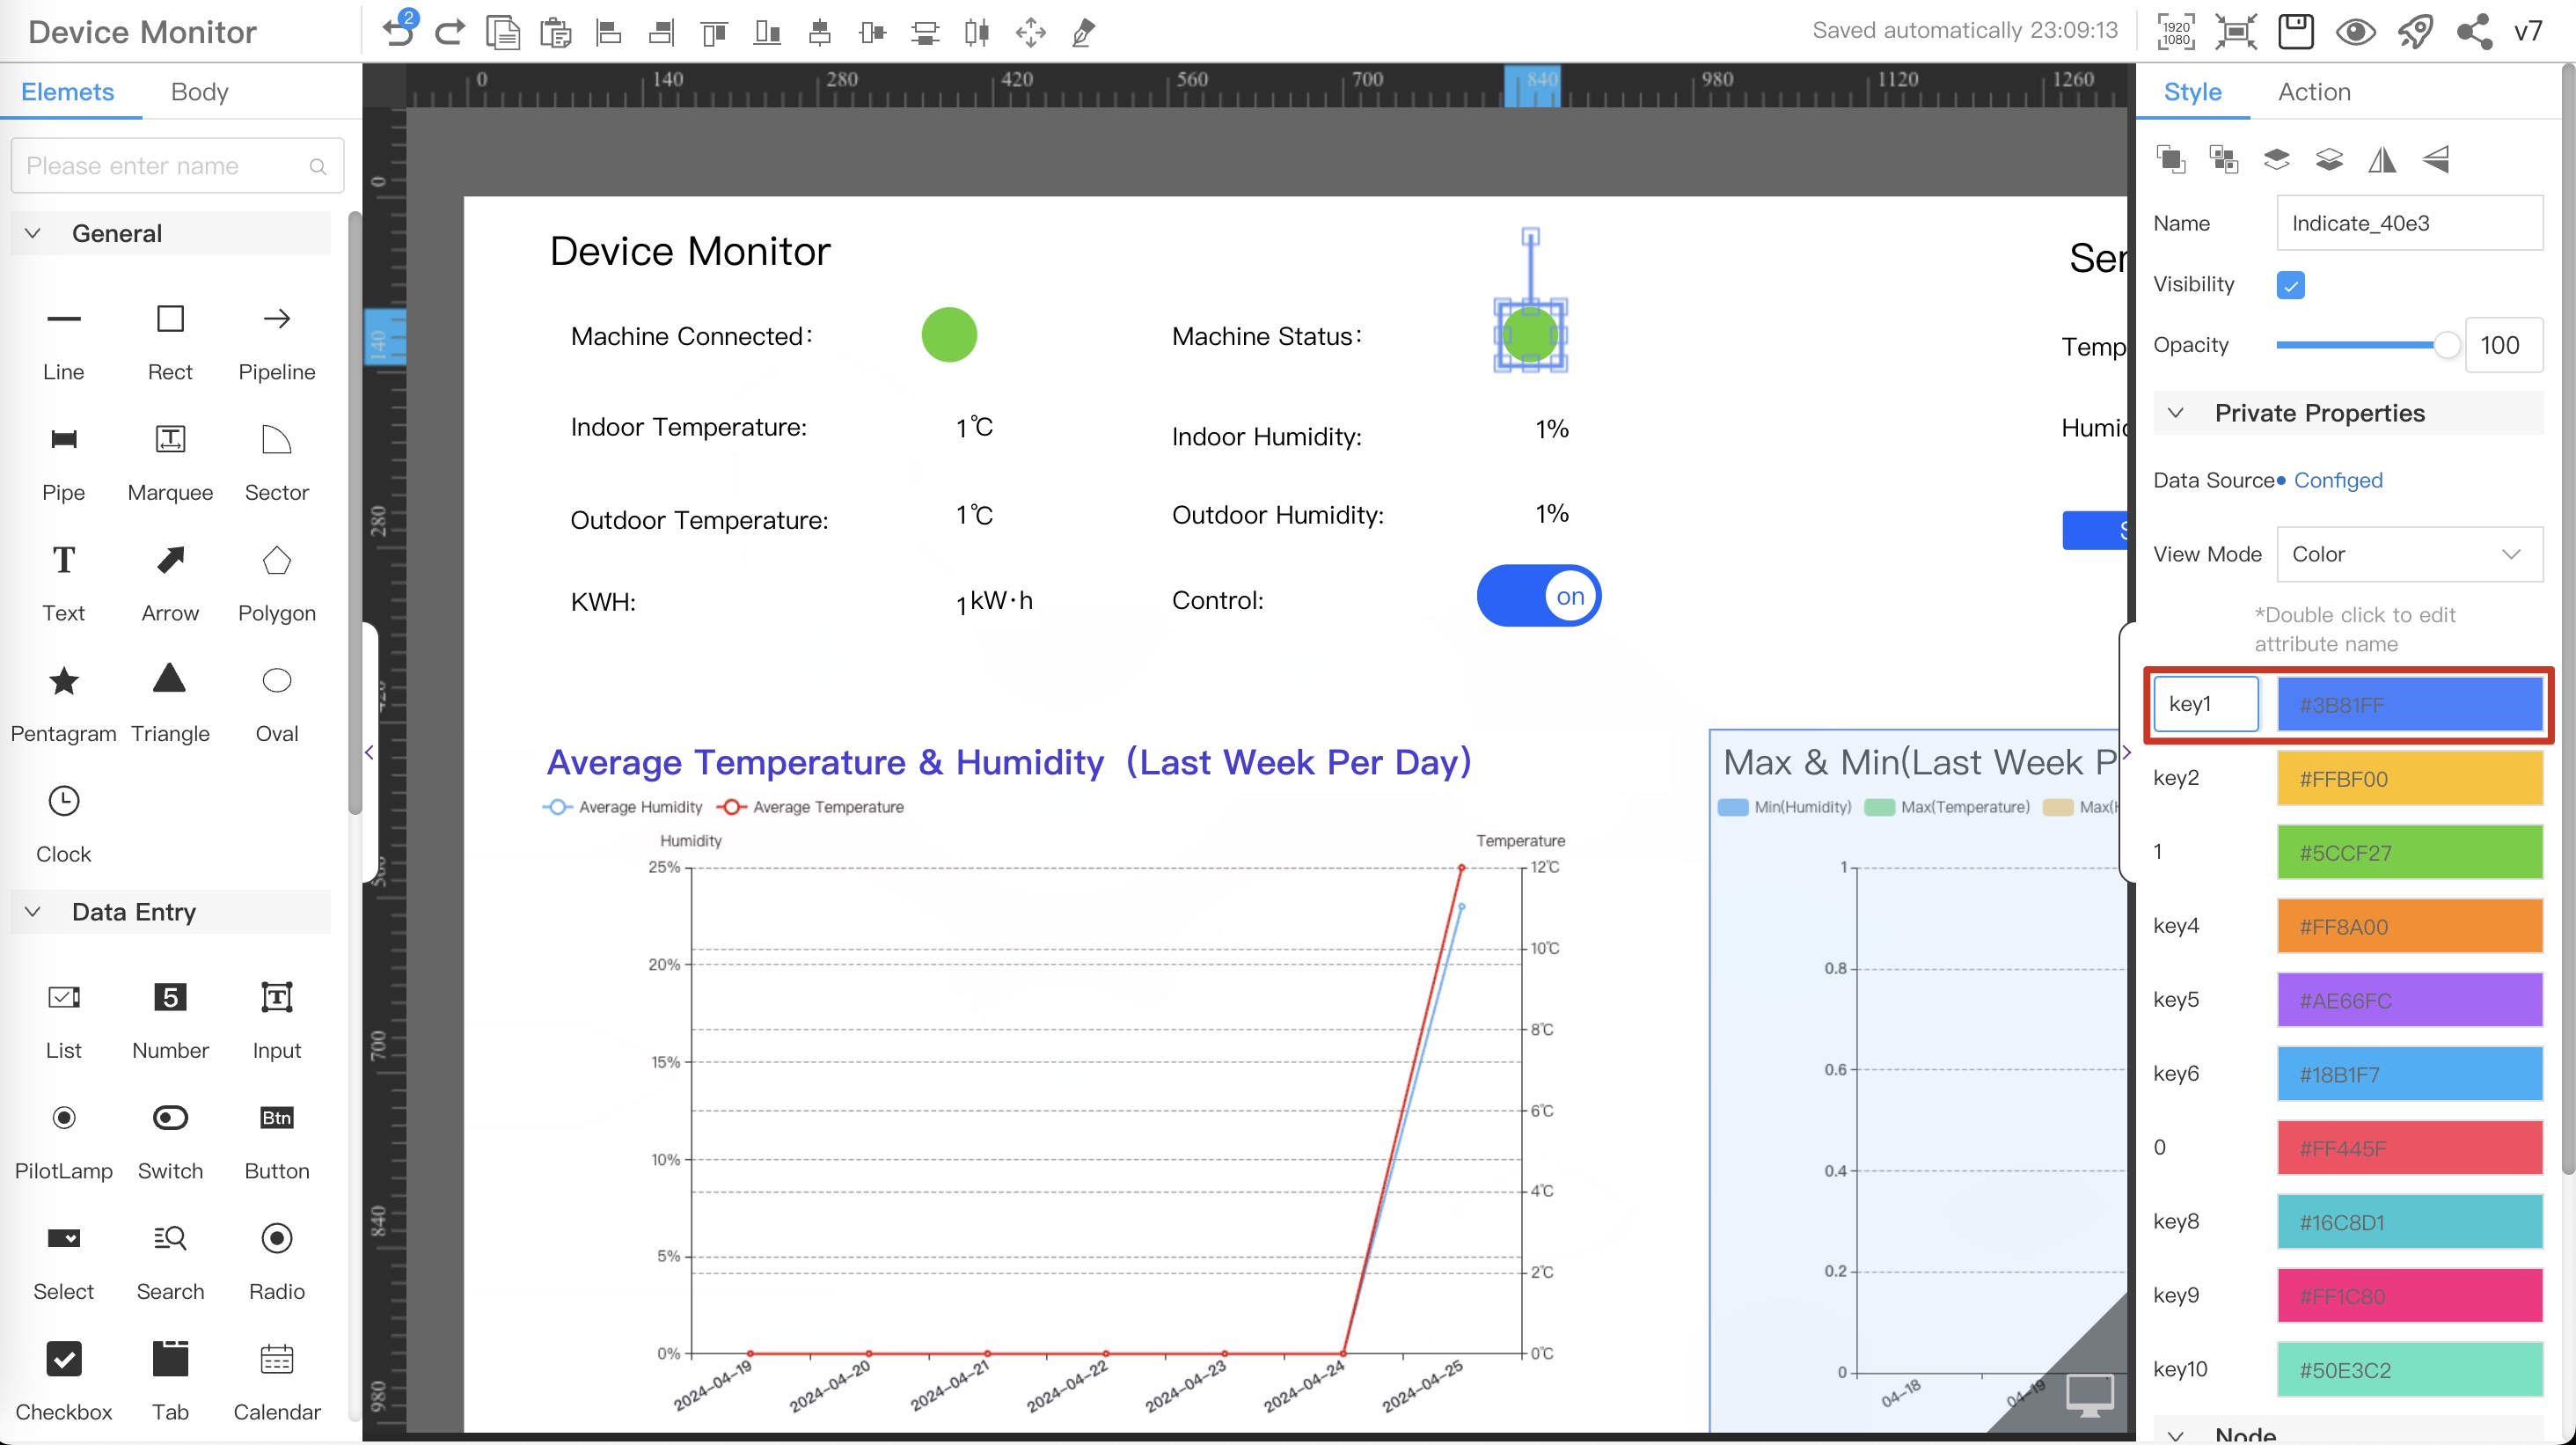
3.1 Double-click Properties
-
3.2 Edit properties and configure colors

-
3.3 The data source config popup, configure the device parameters to be monitored, refer to the sequence number in the figure below
-
Select the
Interfacedata source -
Select
Systemtype data source -
Select Data Source:
Device IoT status, view the meaning of the indicators, please refer to View ix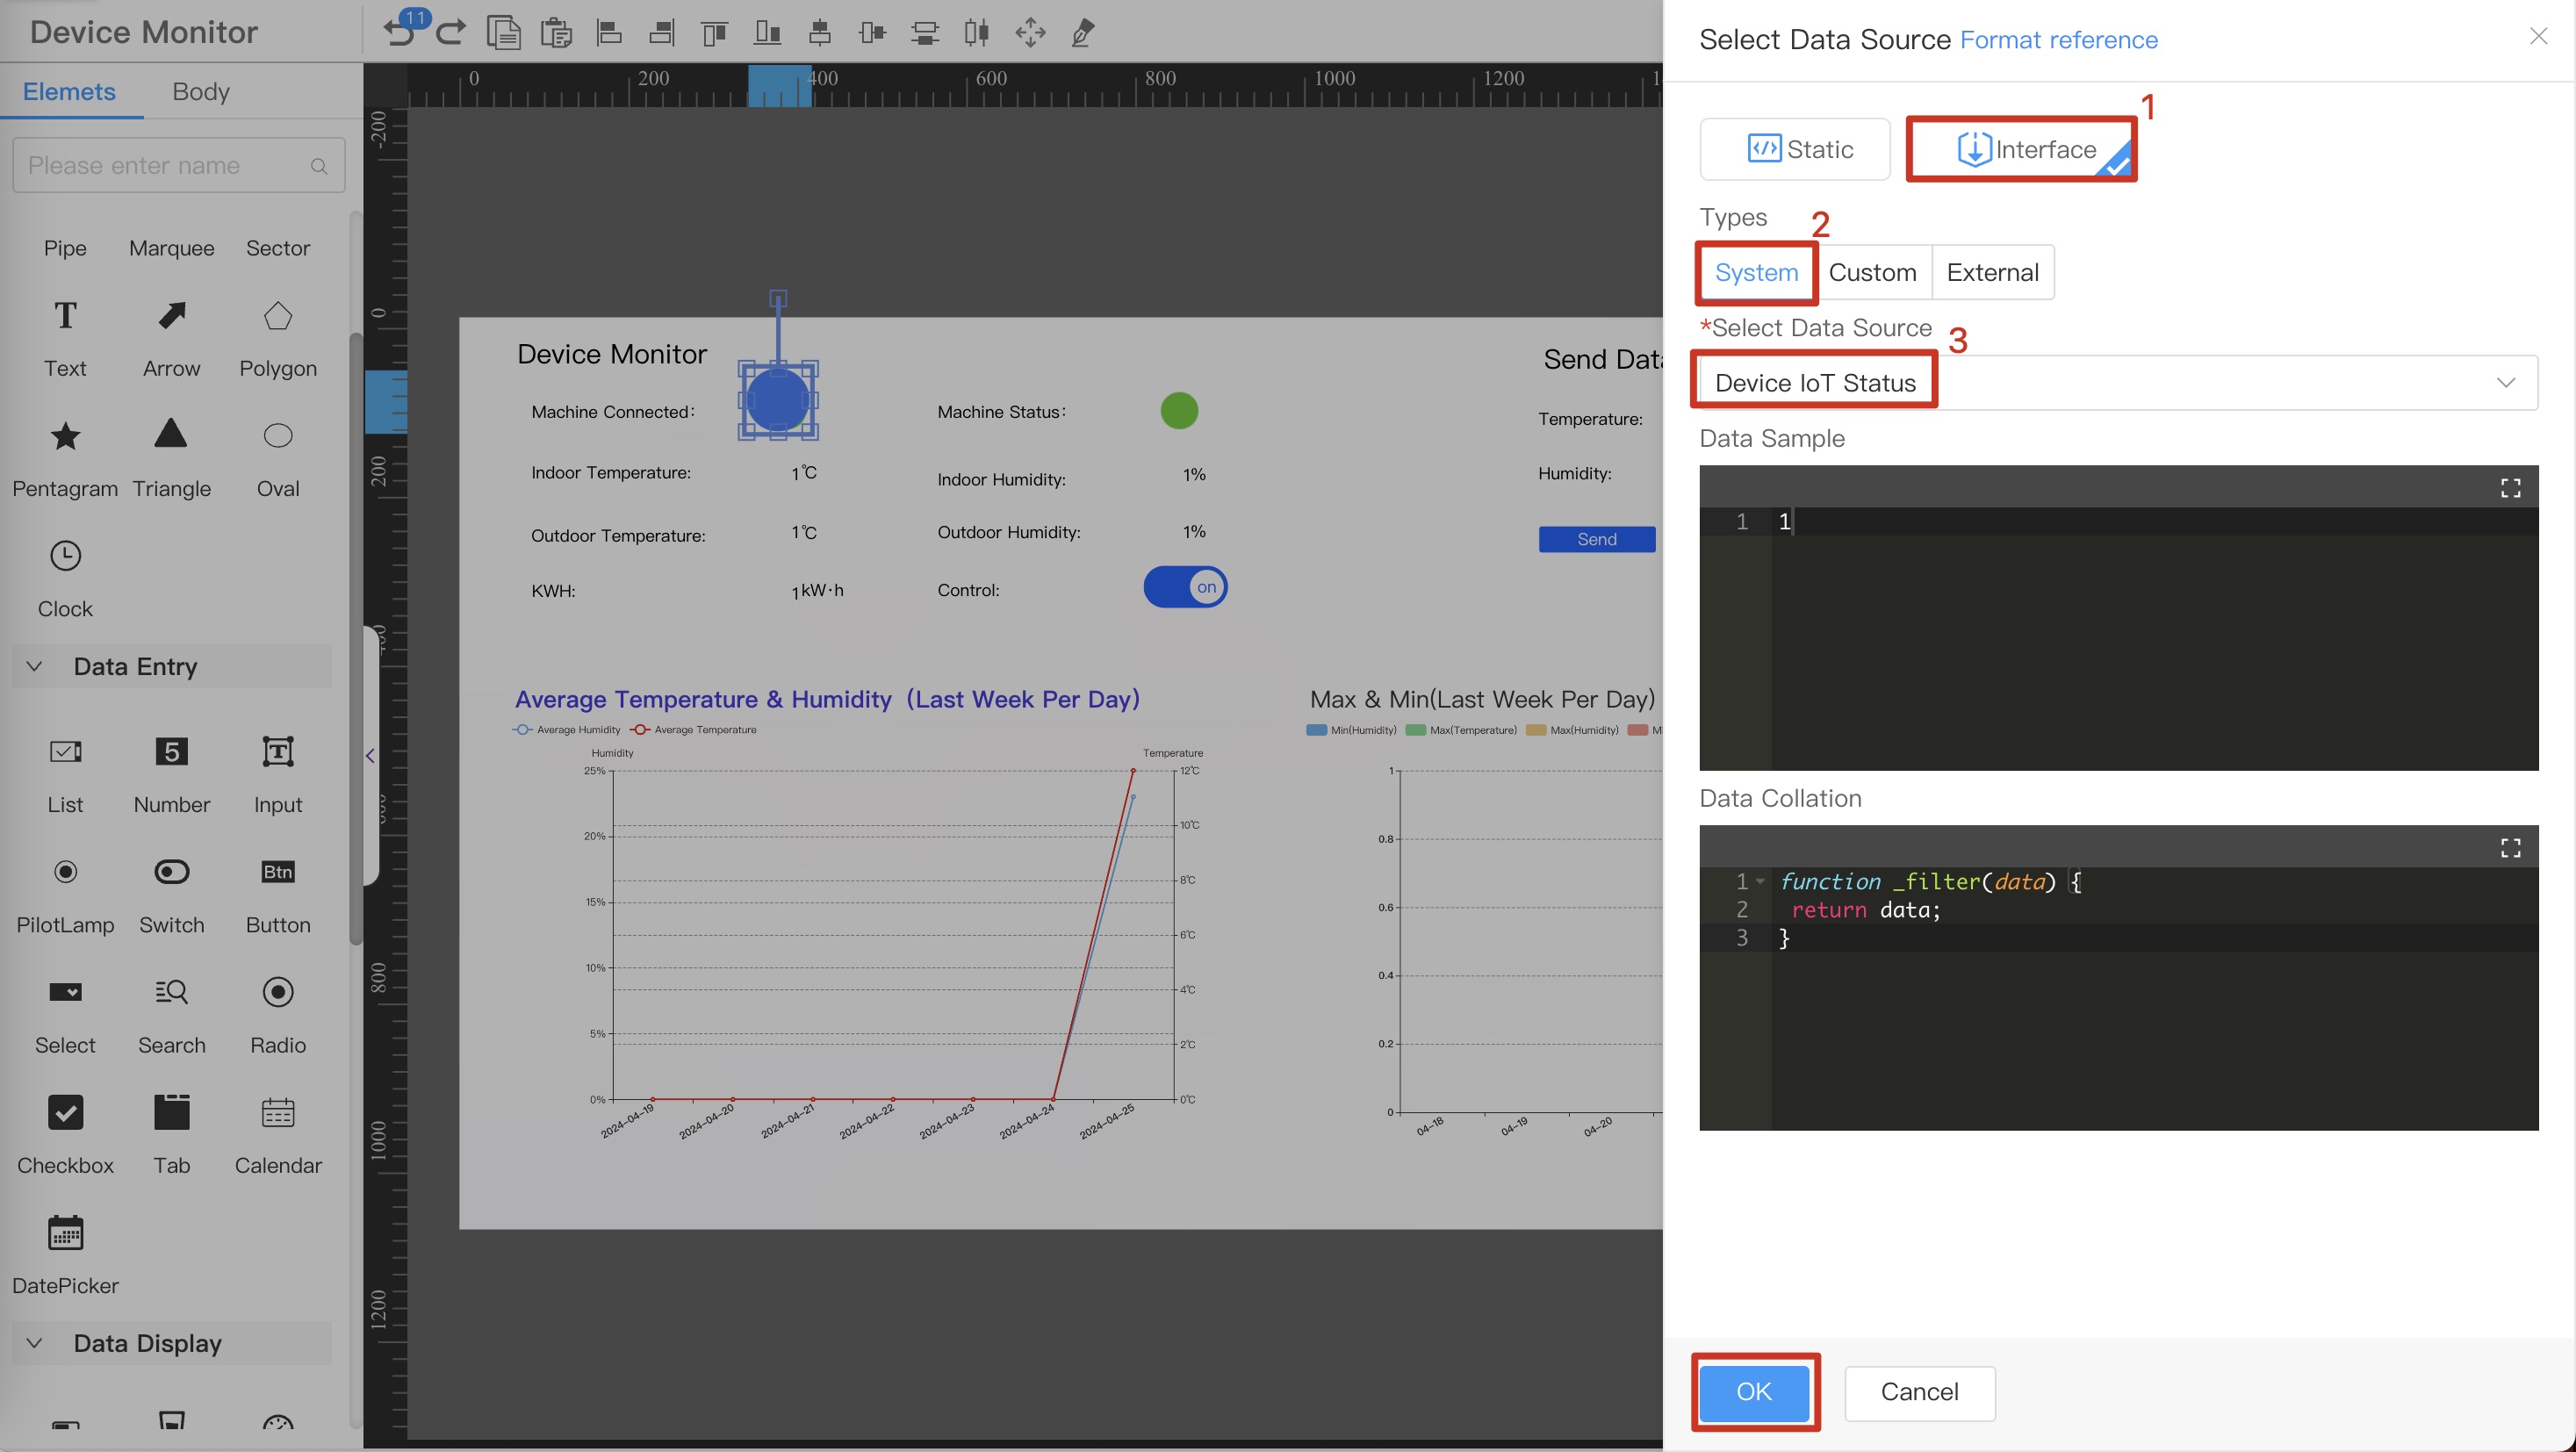
-
-
2. Display device connection status
-
From the component library on the left, select the PilotLamp component and drag it onto the canvas.
-
Select the dragged component, in the style
Data Sourceconfiguration item on the right, click the icon next to it to configure the data source.
-
Configure the corresponding color according to the result returned by the interface
-
3.1 Double-click Properties
-
3.2 Edit properties and configure colors
-
3.3 The data source config popup, configure the device parameters to be monitored, refer to the sequence number in the figure below
-
Select the
Interfacedata source -
Select the
Systemtype data source -
Select Data Source:
Real-time IX valuesdata source -
Select IX:
Machine Status, view the meaning of the indicator, please refer to View ix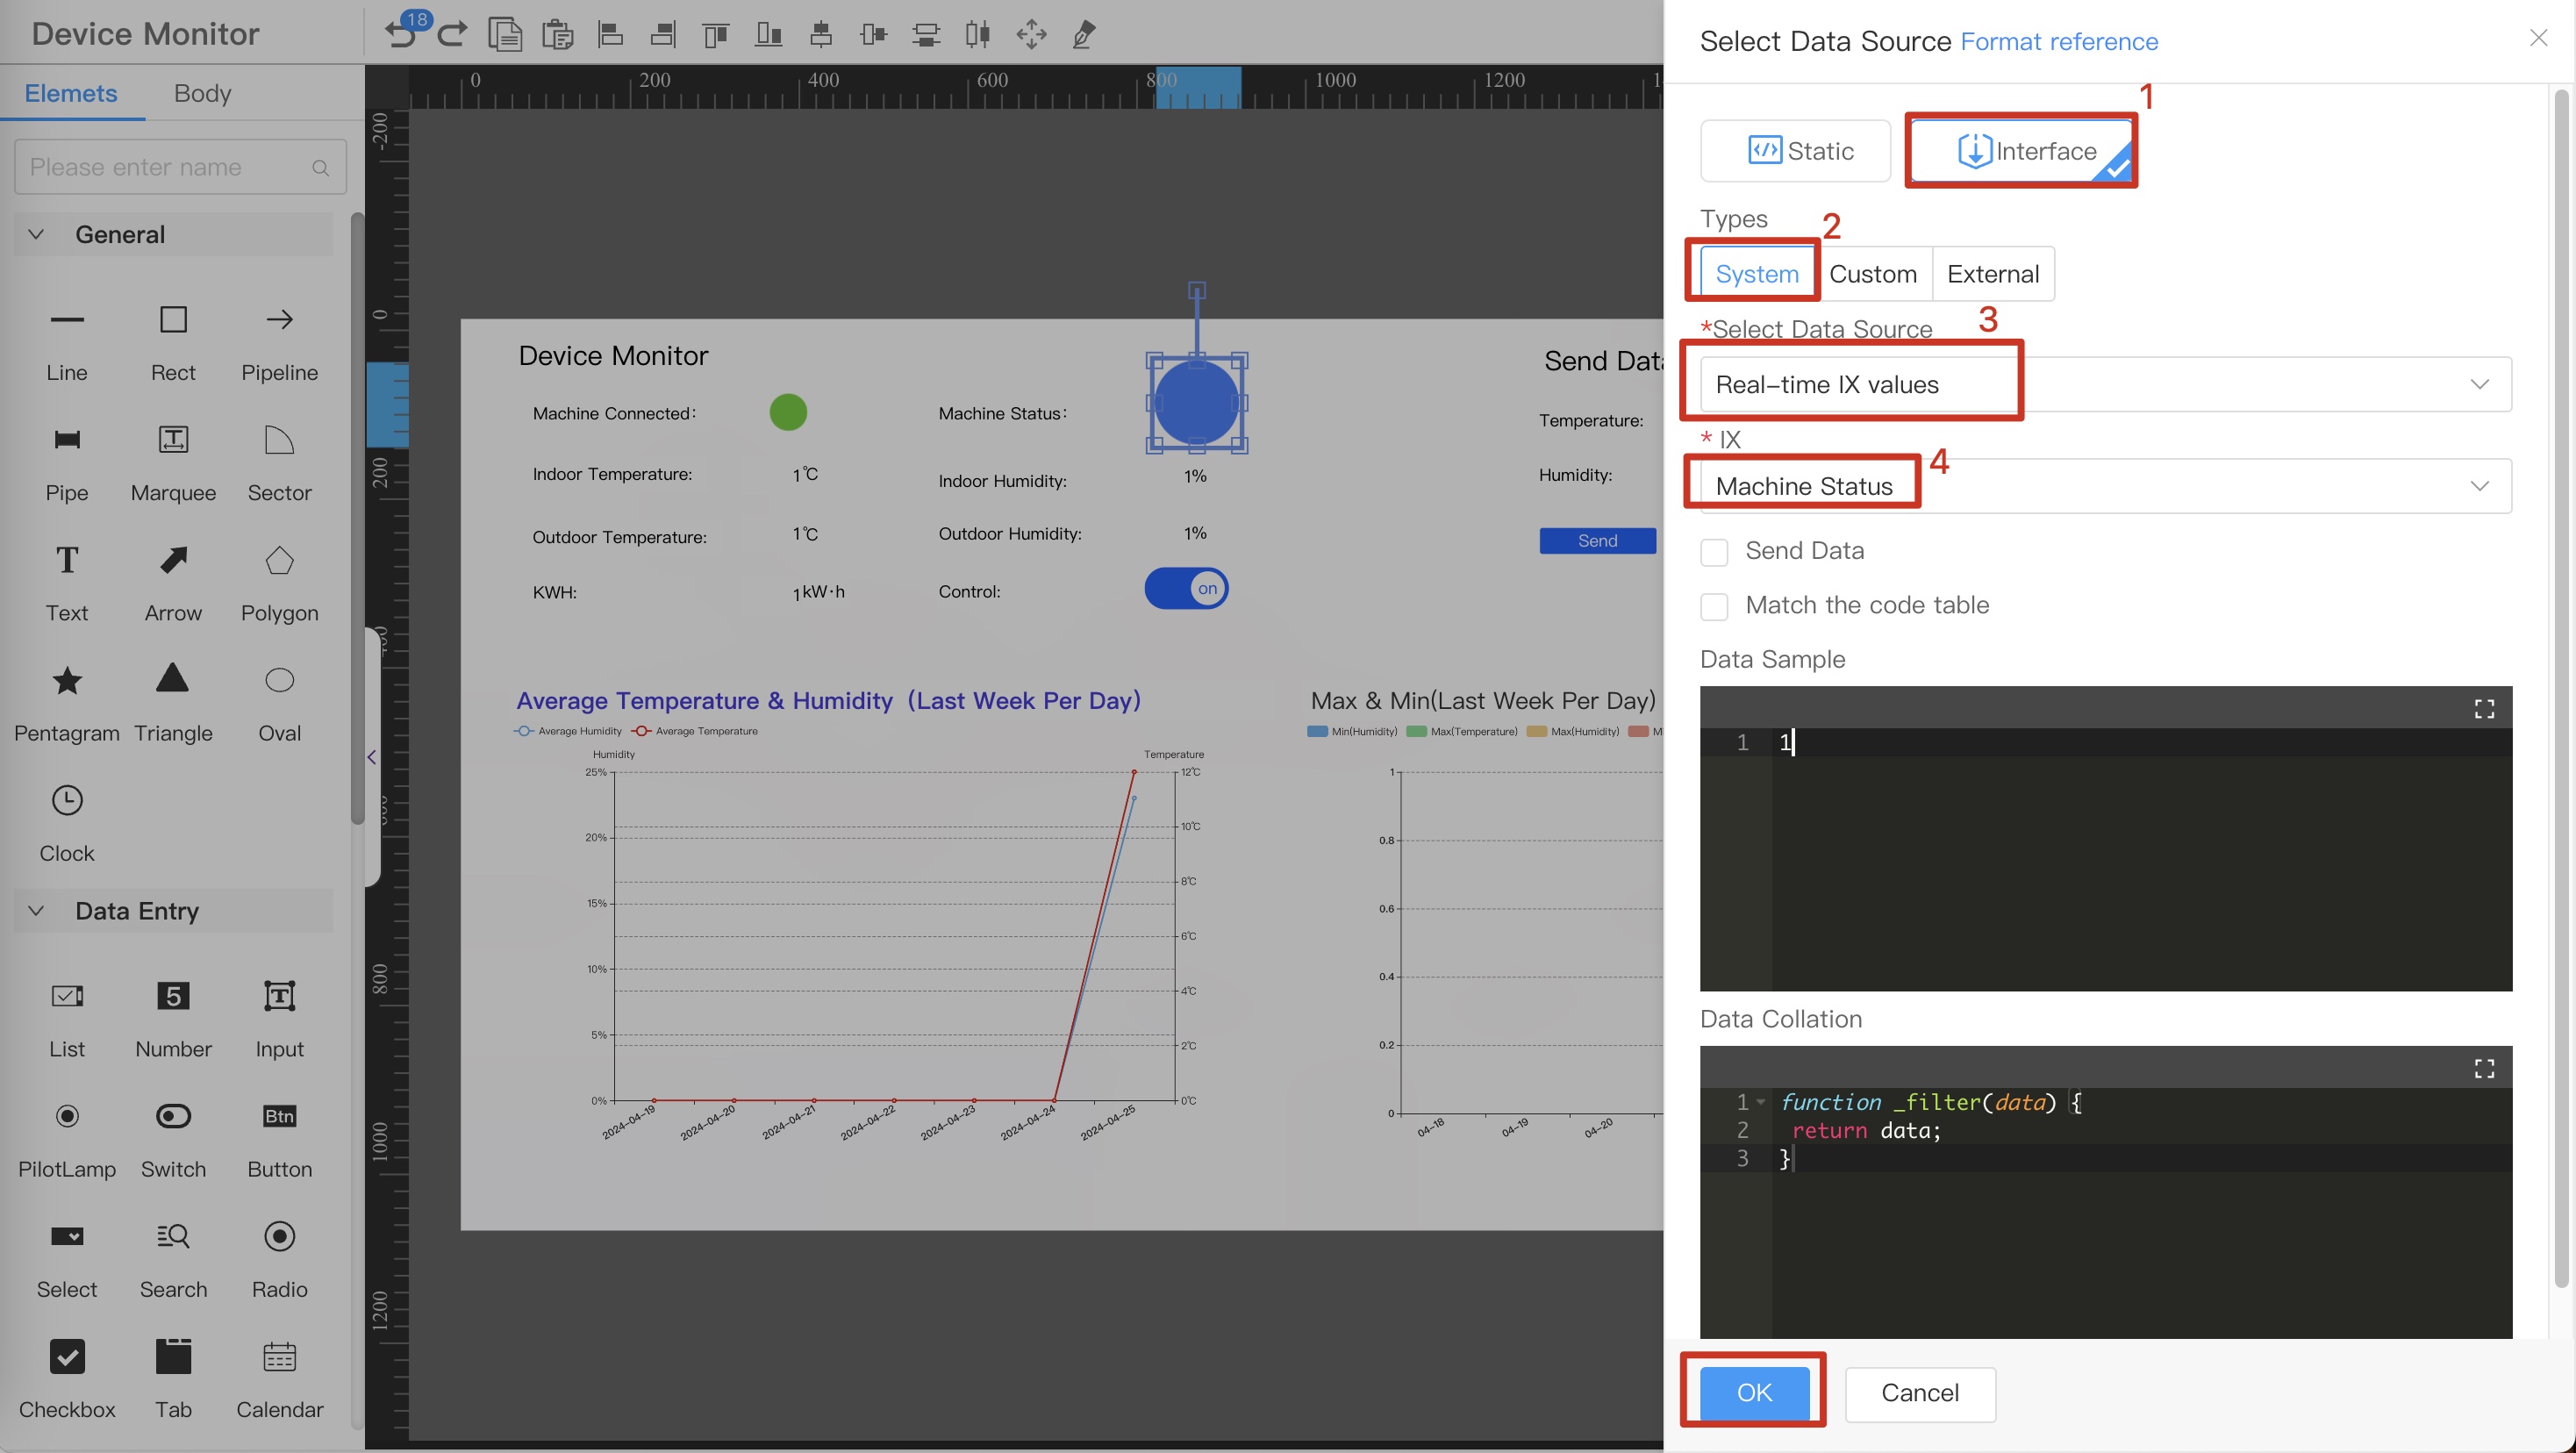
-
-
3. Display device temperature
-
From the component library on the left, select the
Textcomponent and drag it onto the canvas.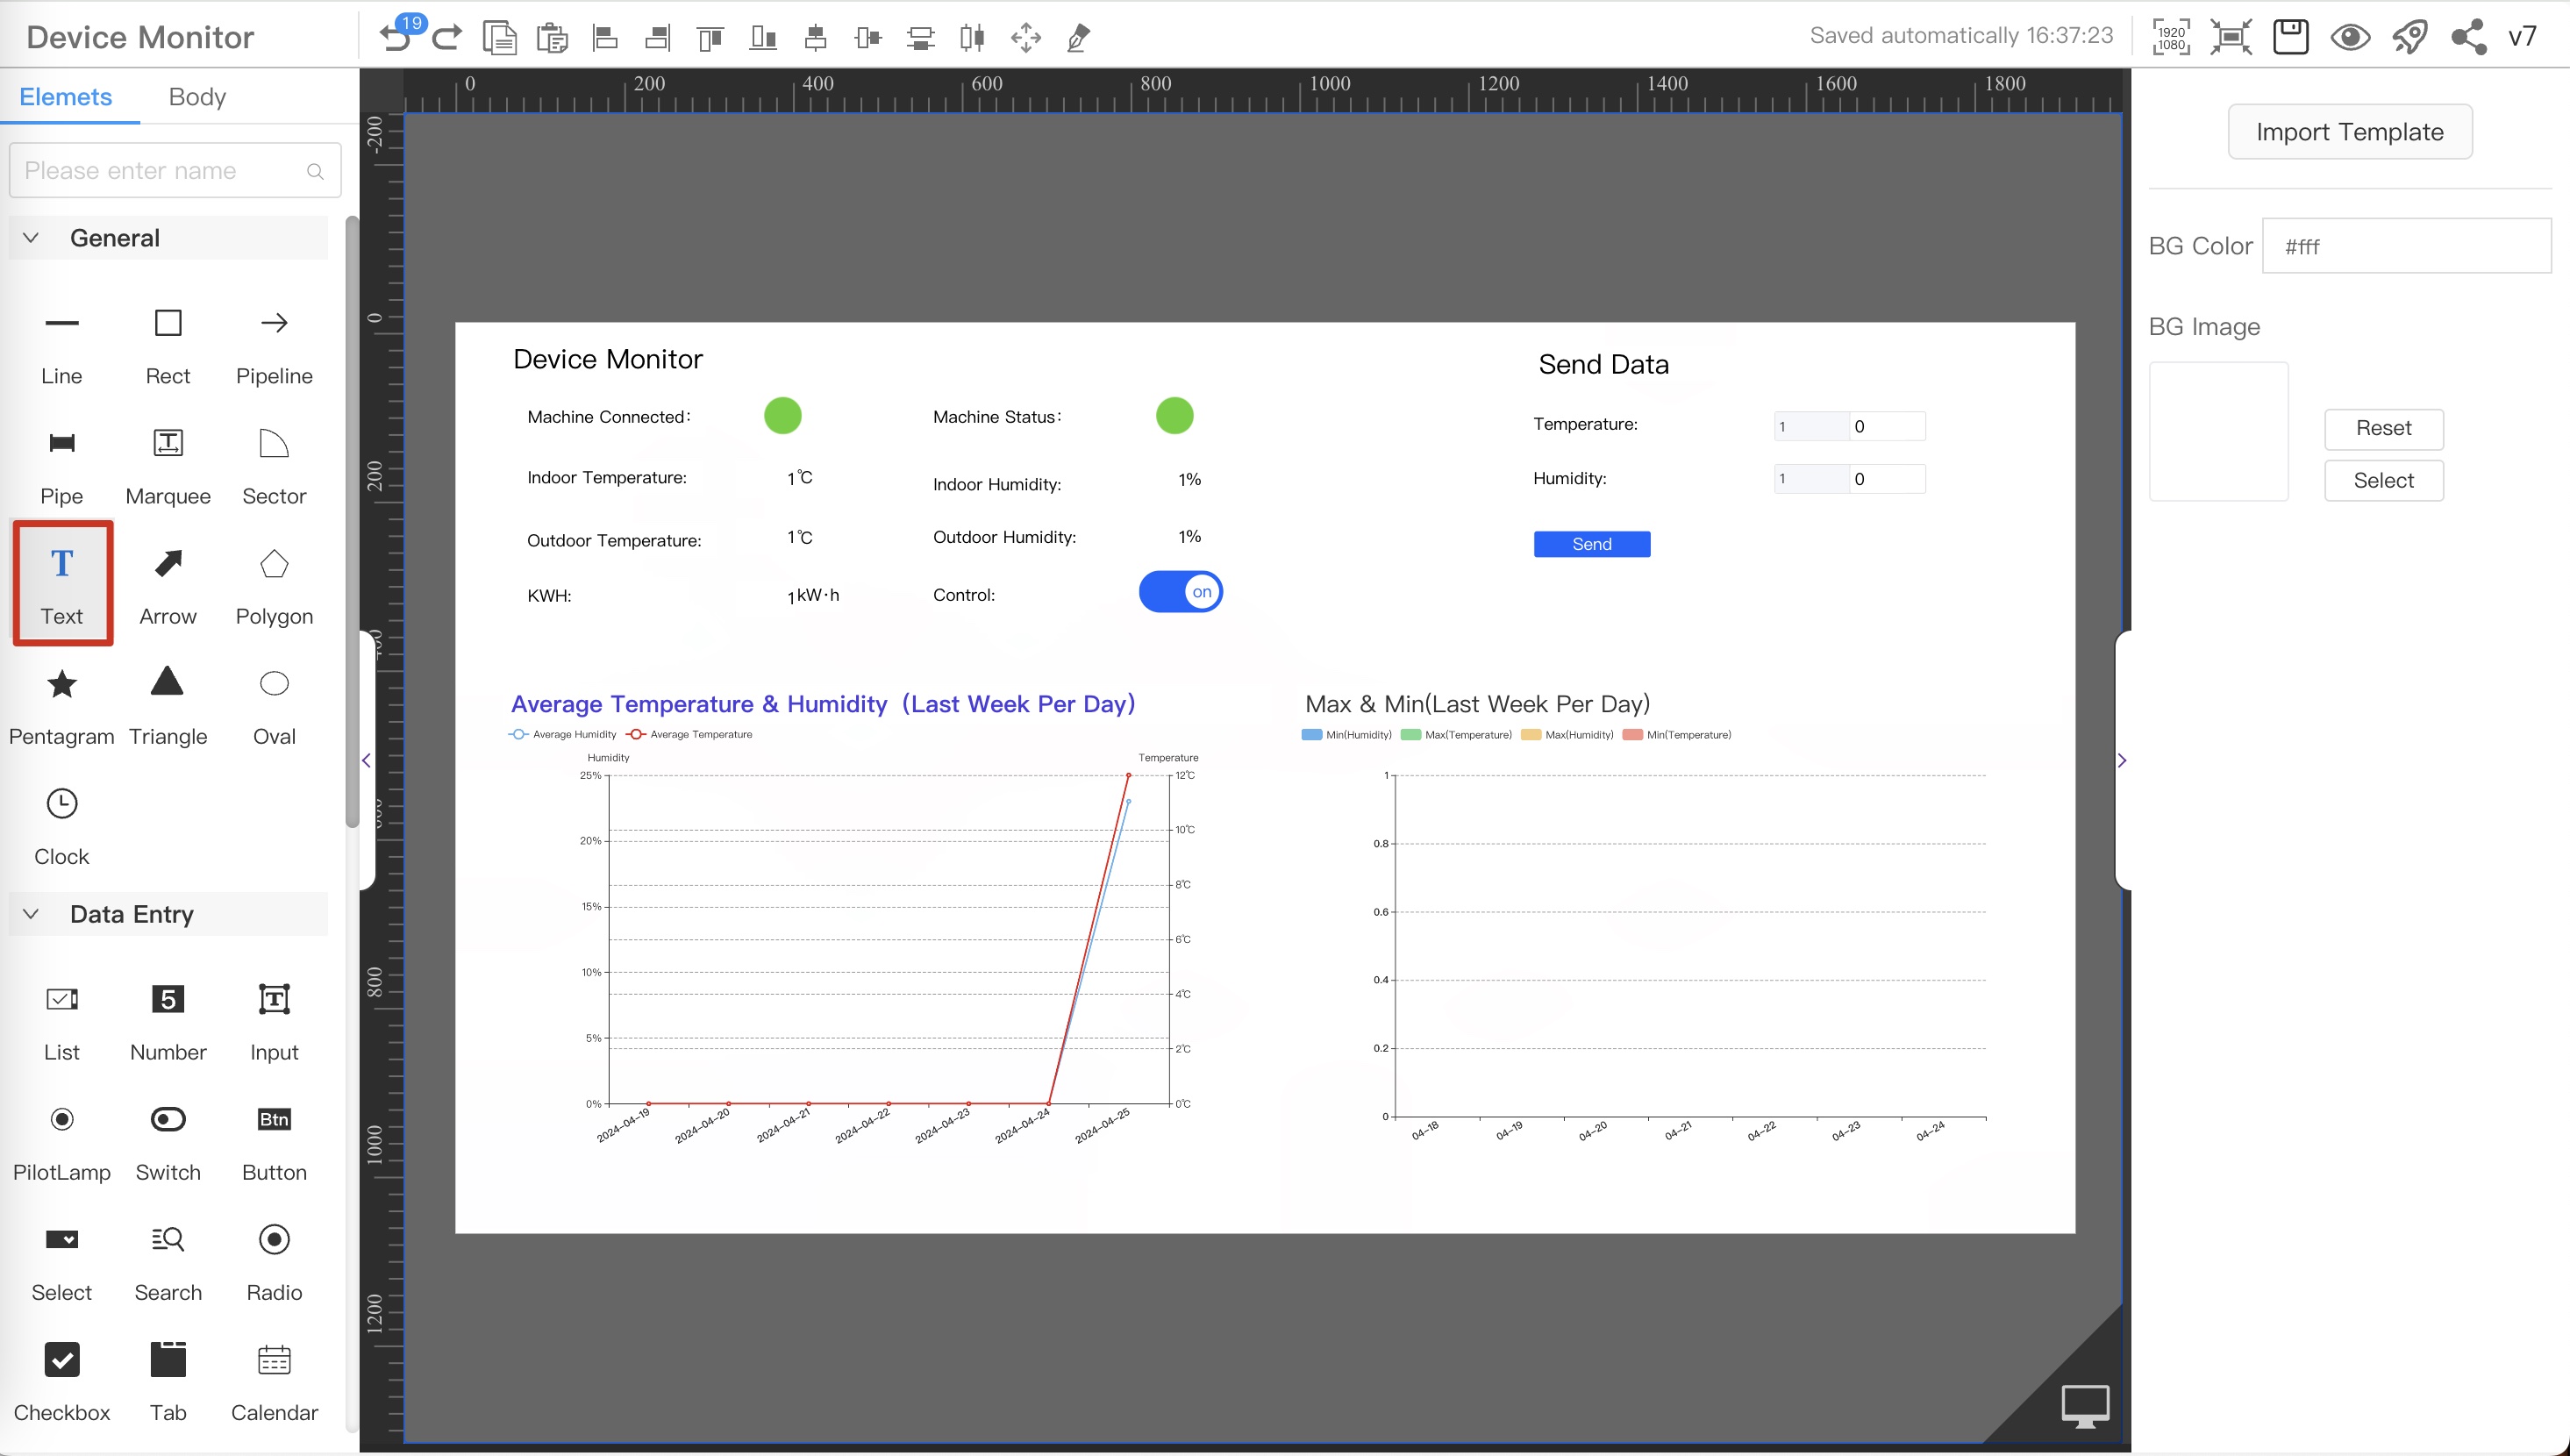
-
Select the dragged component, in the style
Data Sourceconfiguration item on the right, click the icon next to it to configure the data source.
-
The data source configuration interface pops up, configure the device parameters to be monitored, refer to the sequence number in the figure below
- Select the
Interfacedata source - Select the
Systemtype data source - Select Data Source:
Real-time IX valuesdata source - Select IX:
indoor temp, view the meaning of the indicator, please refer to View ix
⚠️ If you want to display more ix, follow the steps above to configure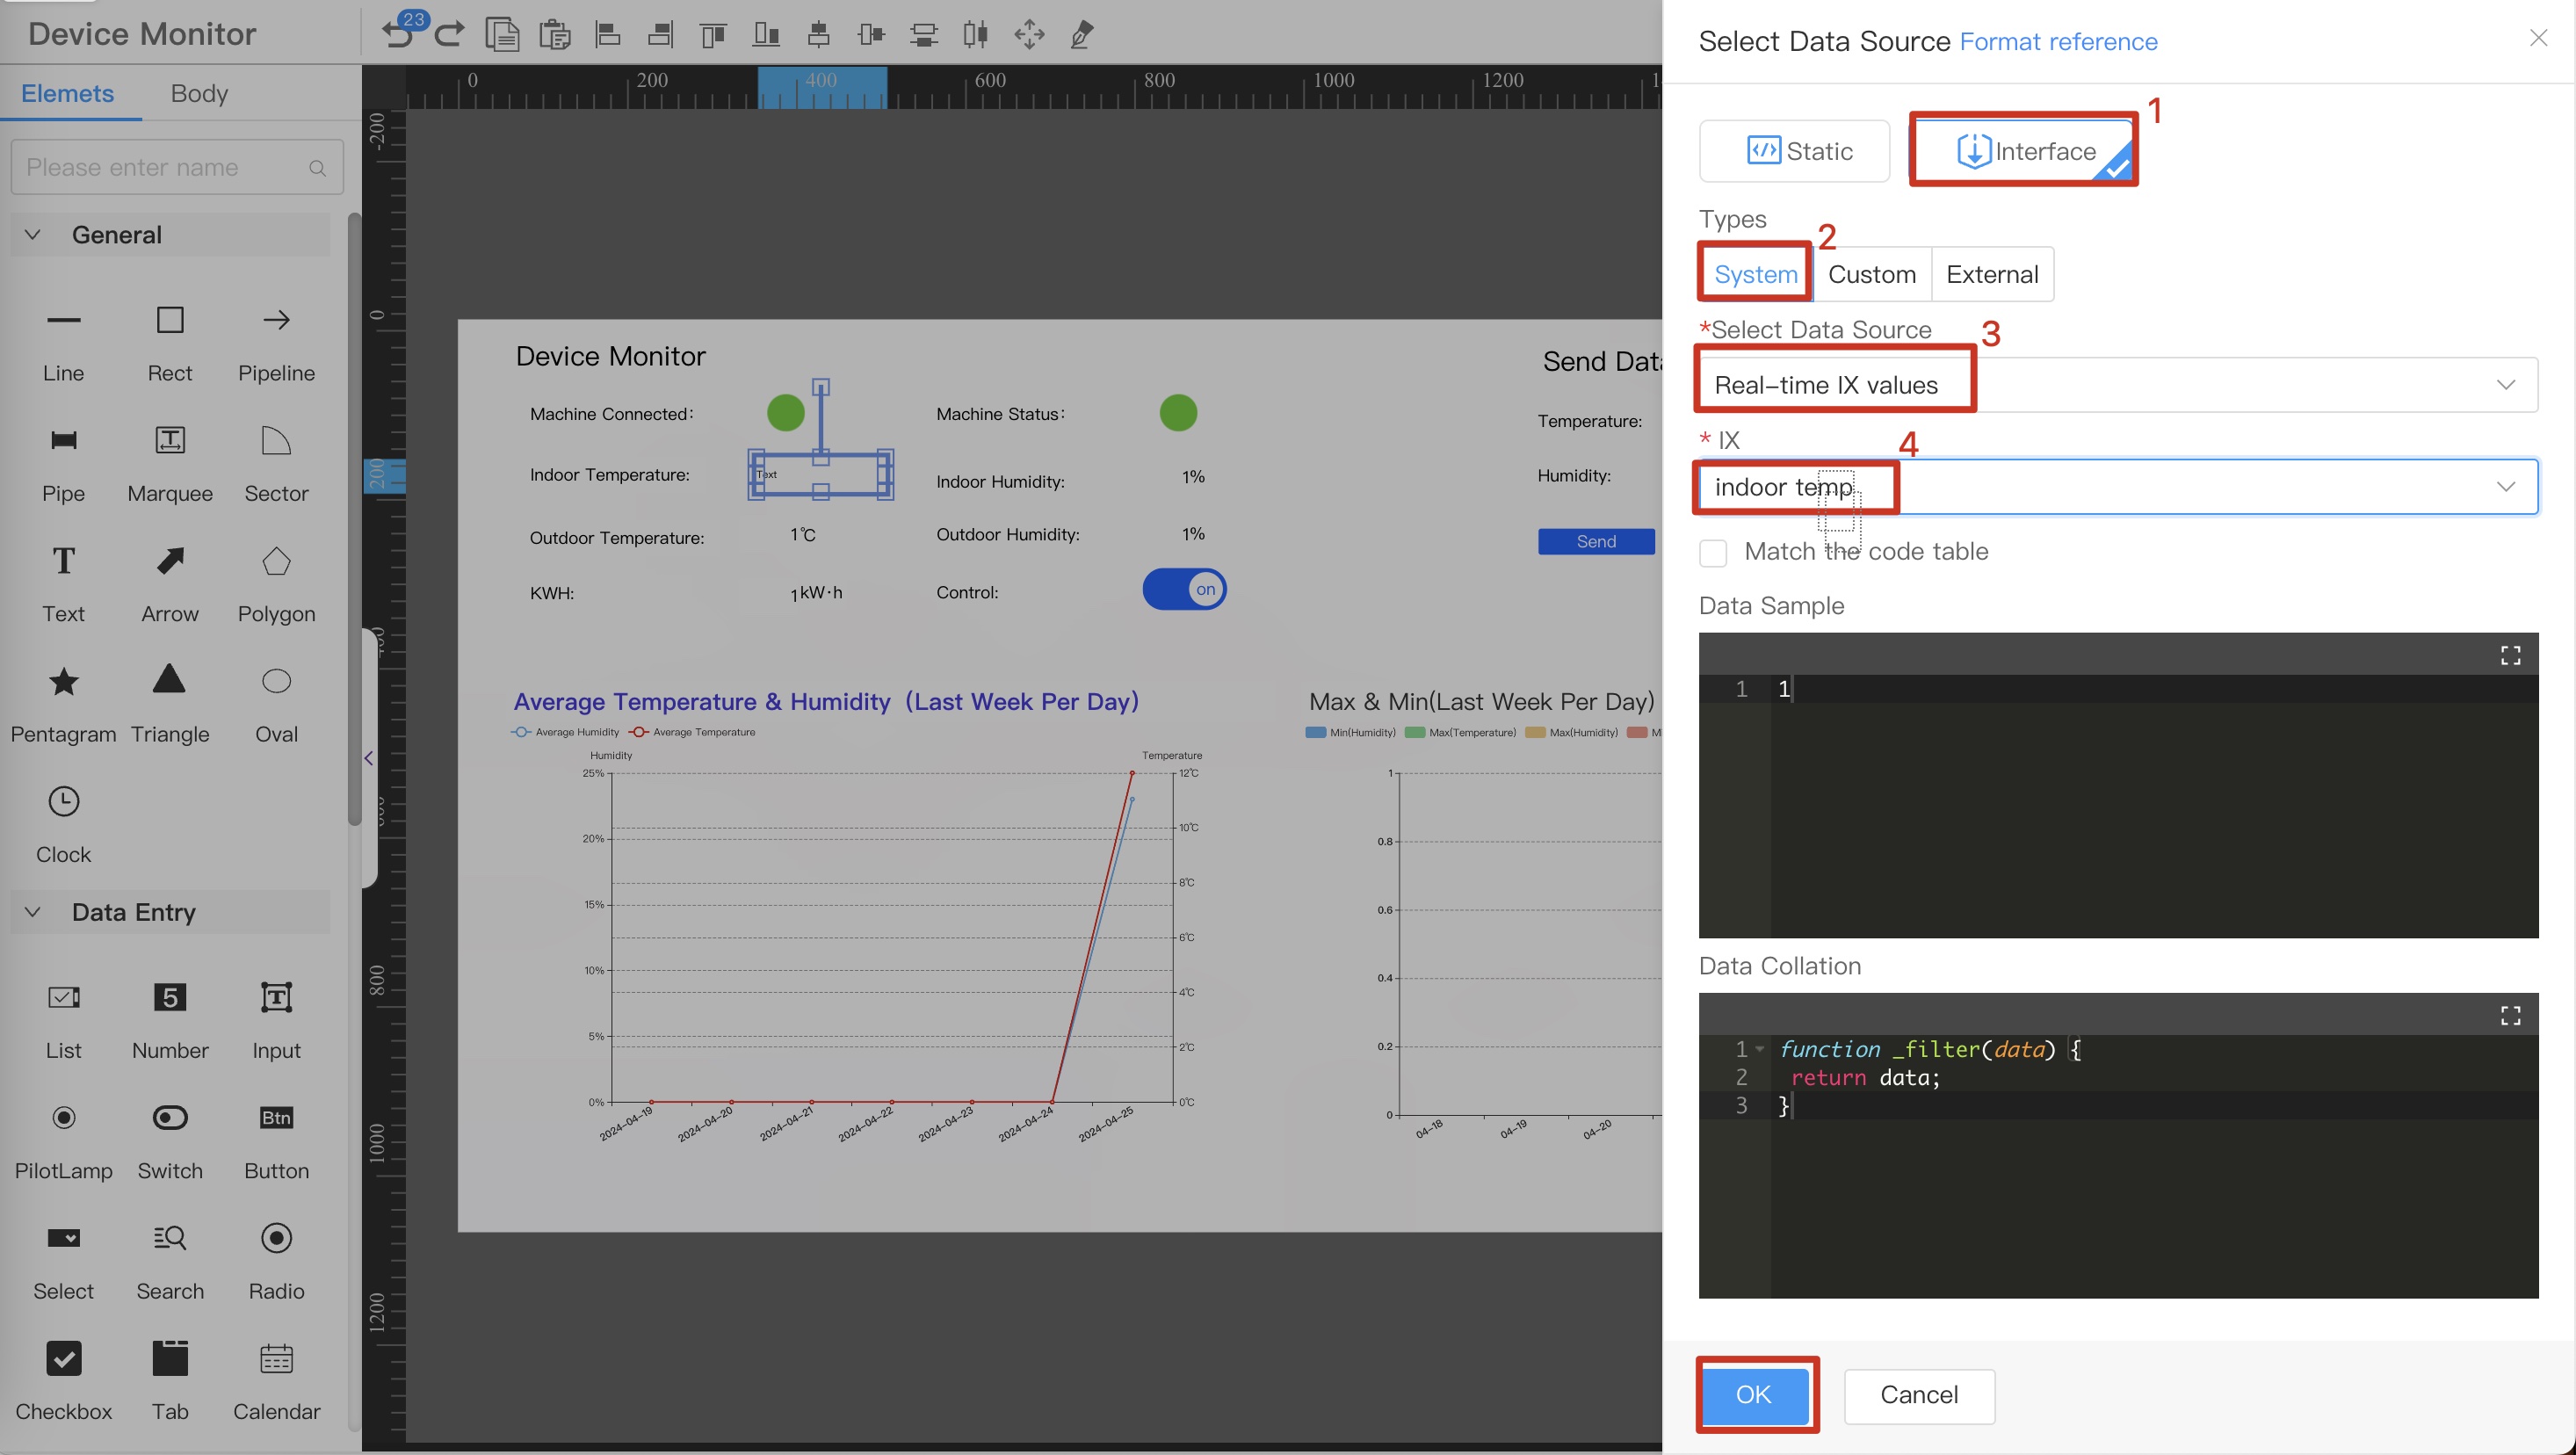
Display device temperature - Select the
4. Issue device parameters
-
From the component library on the left, select the Number component and drag it onto the canvas.

-
Select the dragged component, in the style
Data Sourceconfiguration item on the right, click the icon next to it to configure the data source.
-
The data source configuration interface pops up, configure the device parameters to be monitored, refer to the sequence number in the figure below
- Select the
Interfacedata source - Select the
Systemtype data source - Select Data Source:
Real-time IX valuesdata source - Select IX:
Temperature Set, which indicators can be sent, please refer to View send ix - Select
Send Data - Select
Current Value
⚠️NoteCurrent Value: indicates the current value of the component,Fixed Value: indicates a fixed value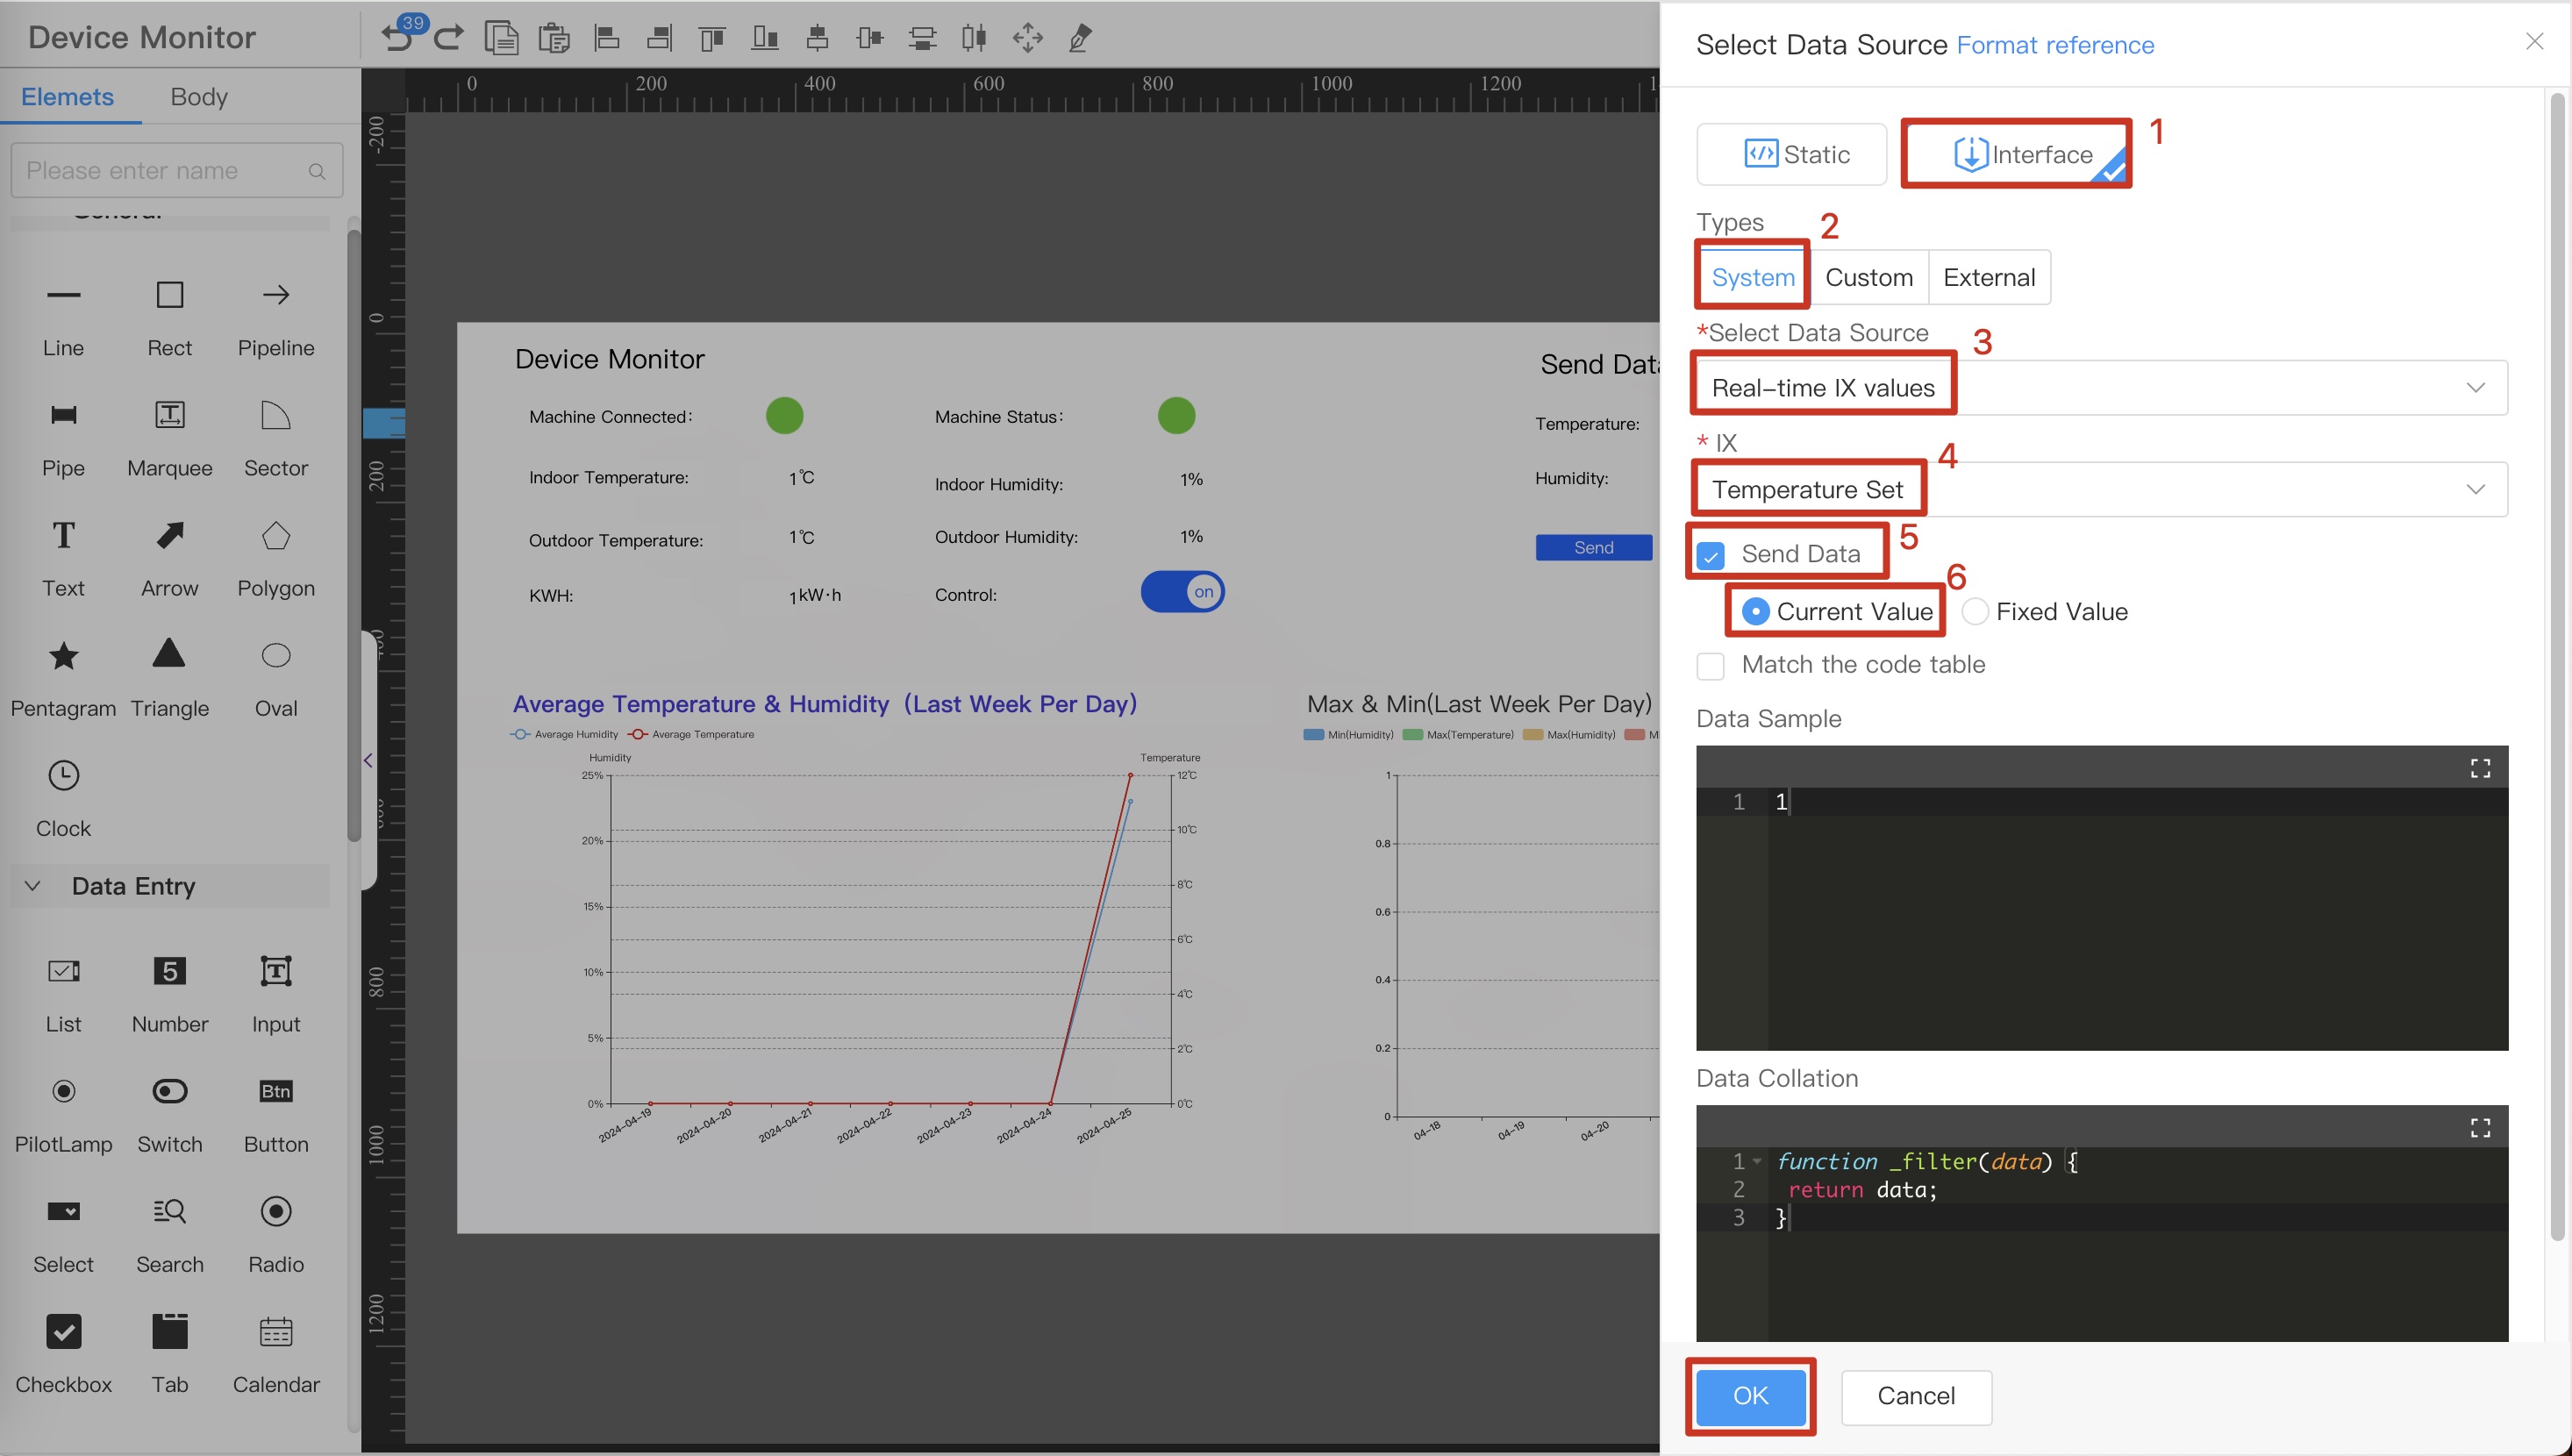
- Select the
-
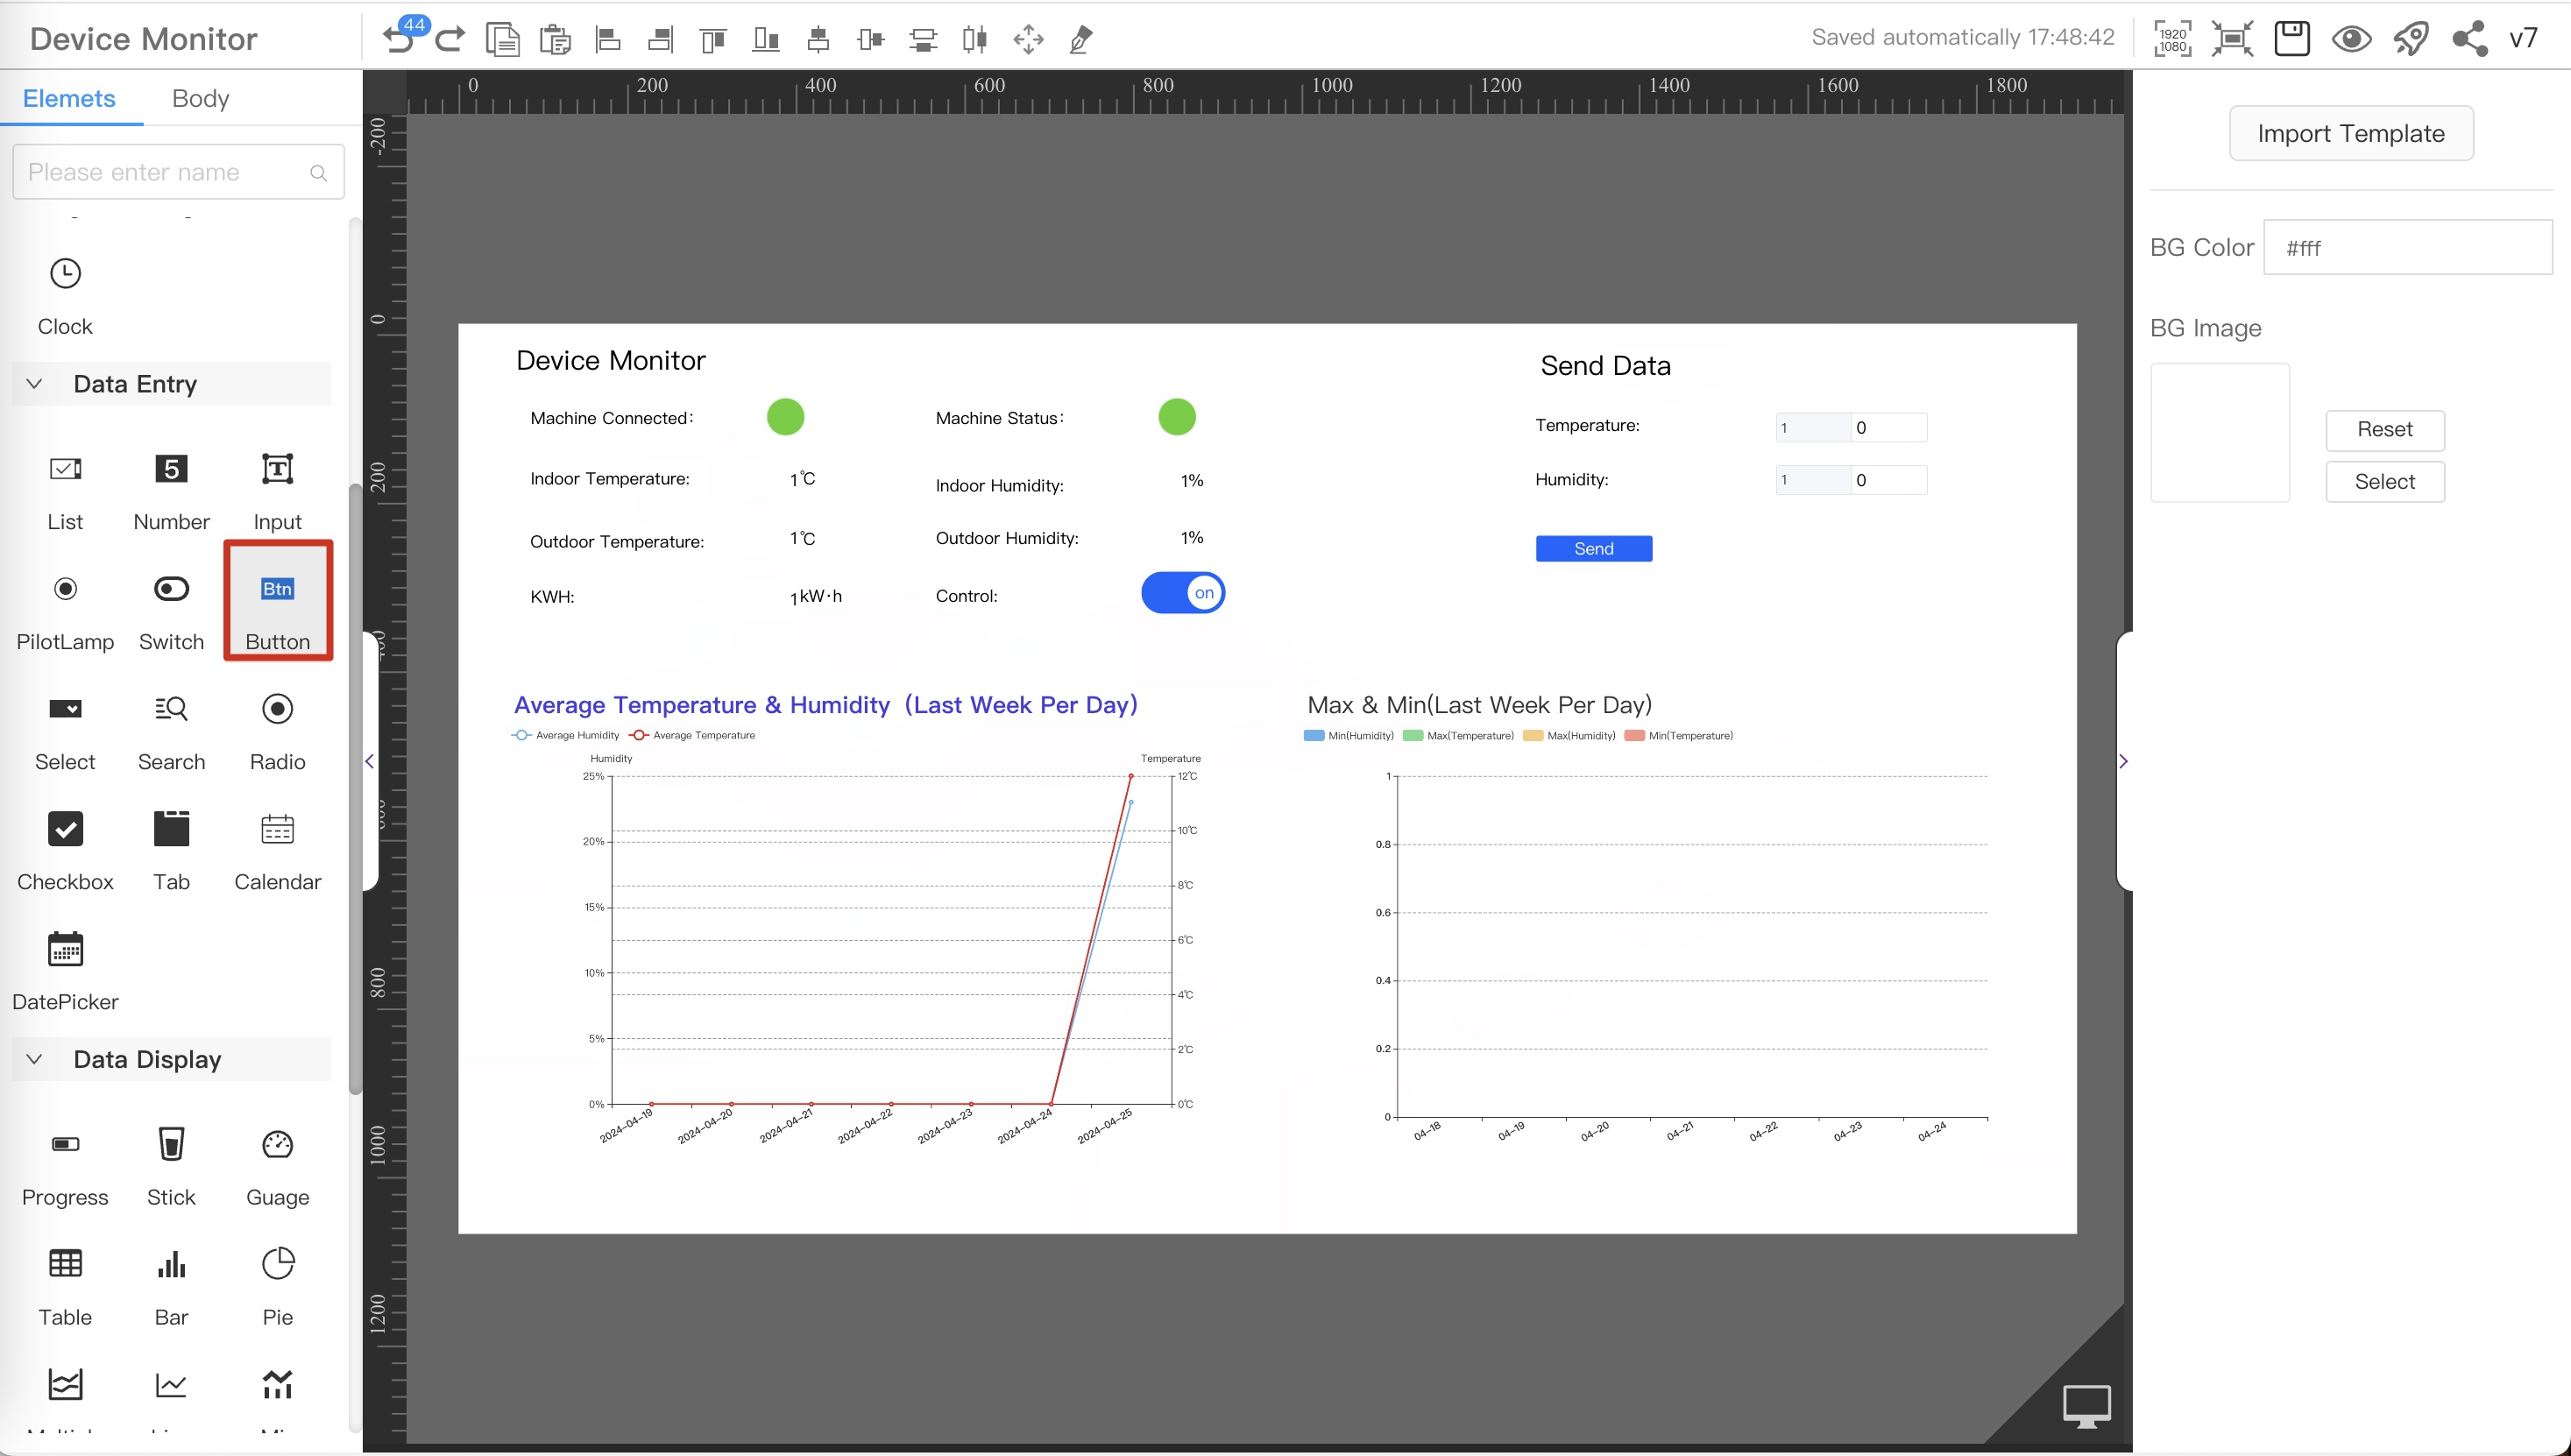
From the component library on the left, select the
Buttoncomponent and drag it into the canvas.
-
Select the
Buttoncomponent in the previous step, and configure the parameters in theActionon the right, referring to the sequence number in the figure below- Select
Action - Select the
ClickEvent - Select the
Send Dataaction - Select the
Numbercomponent name from the previous step. To view the component name, please refer to View component name
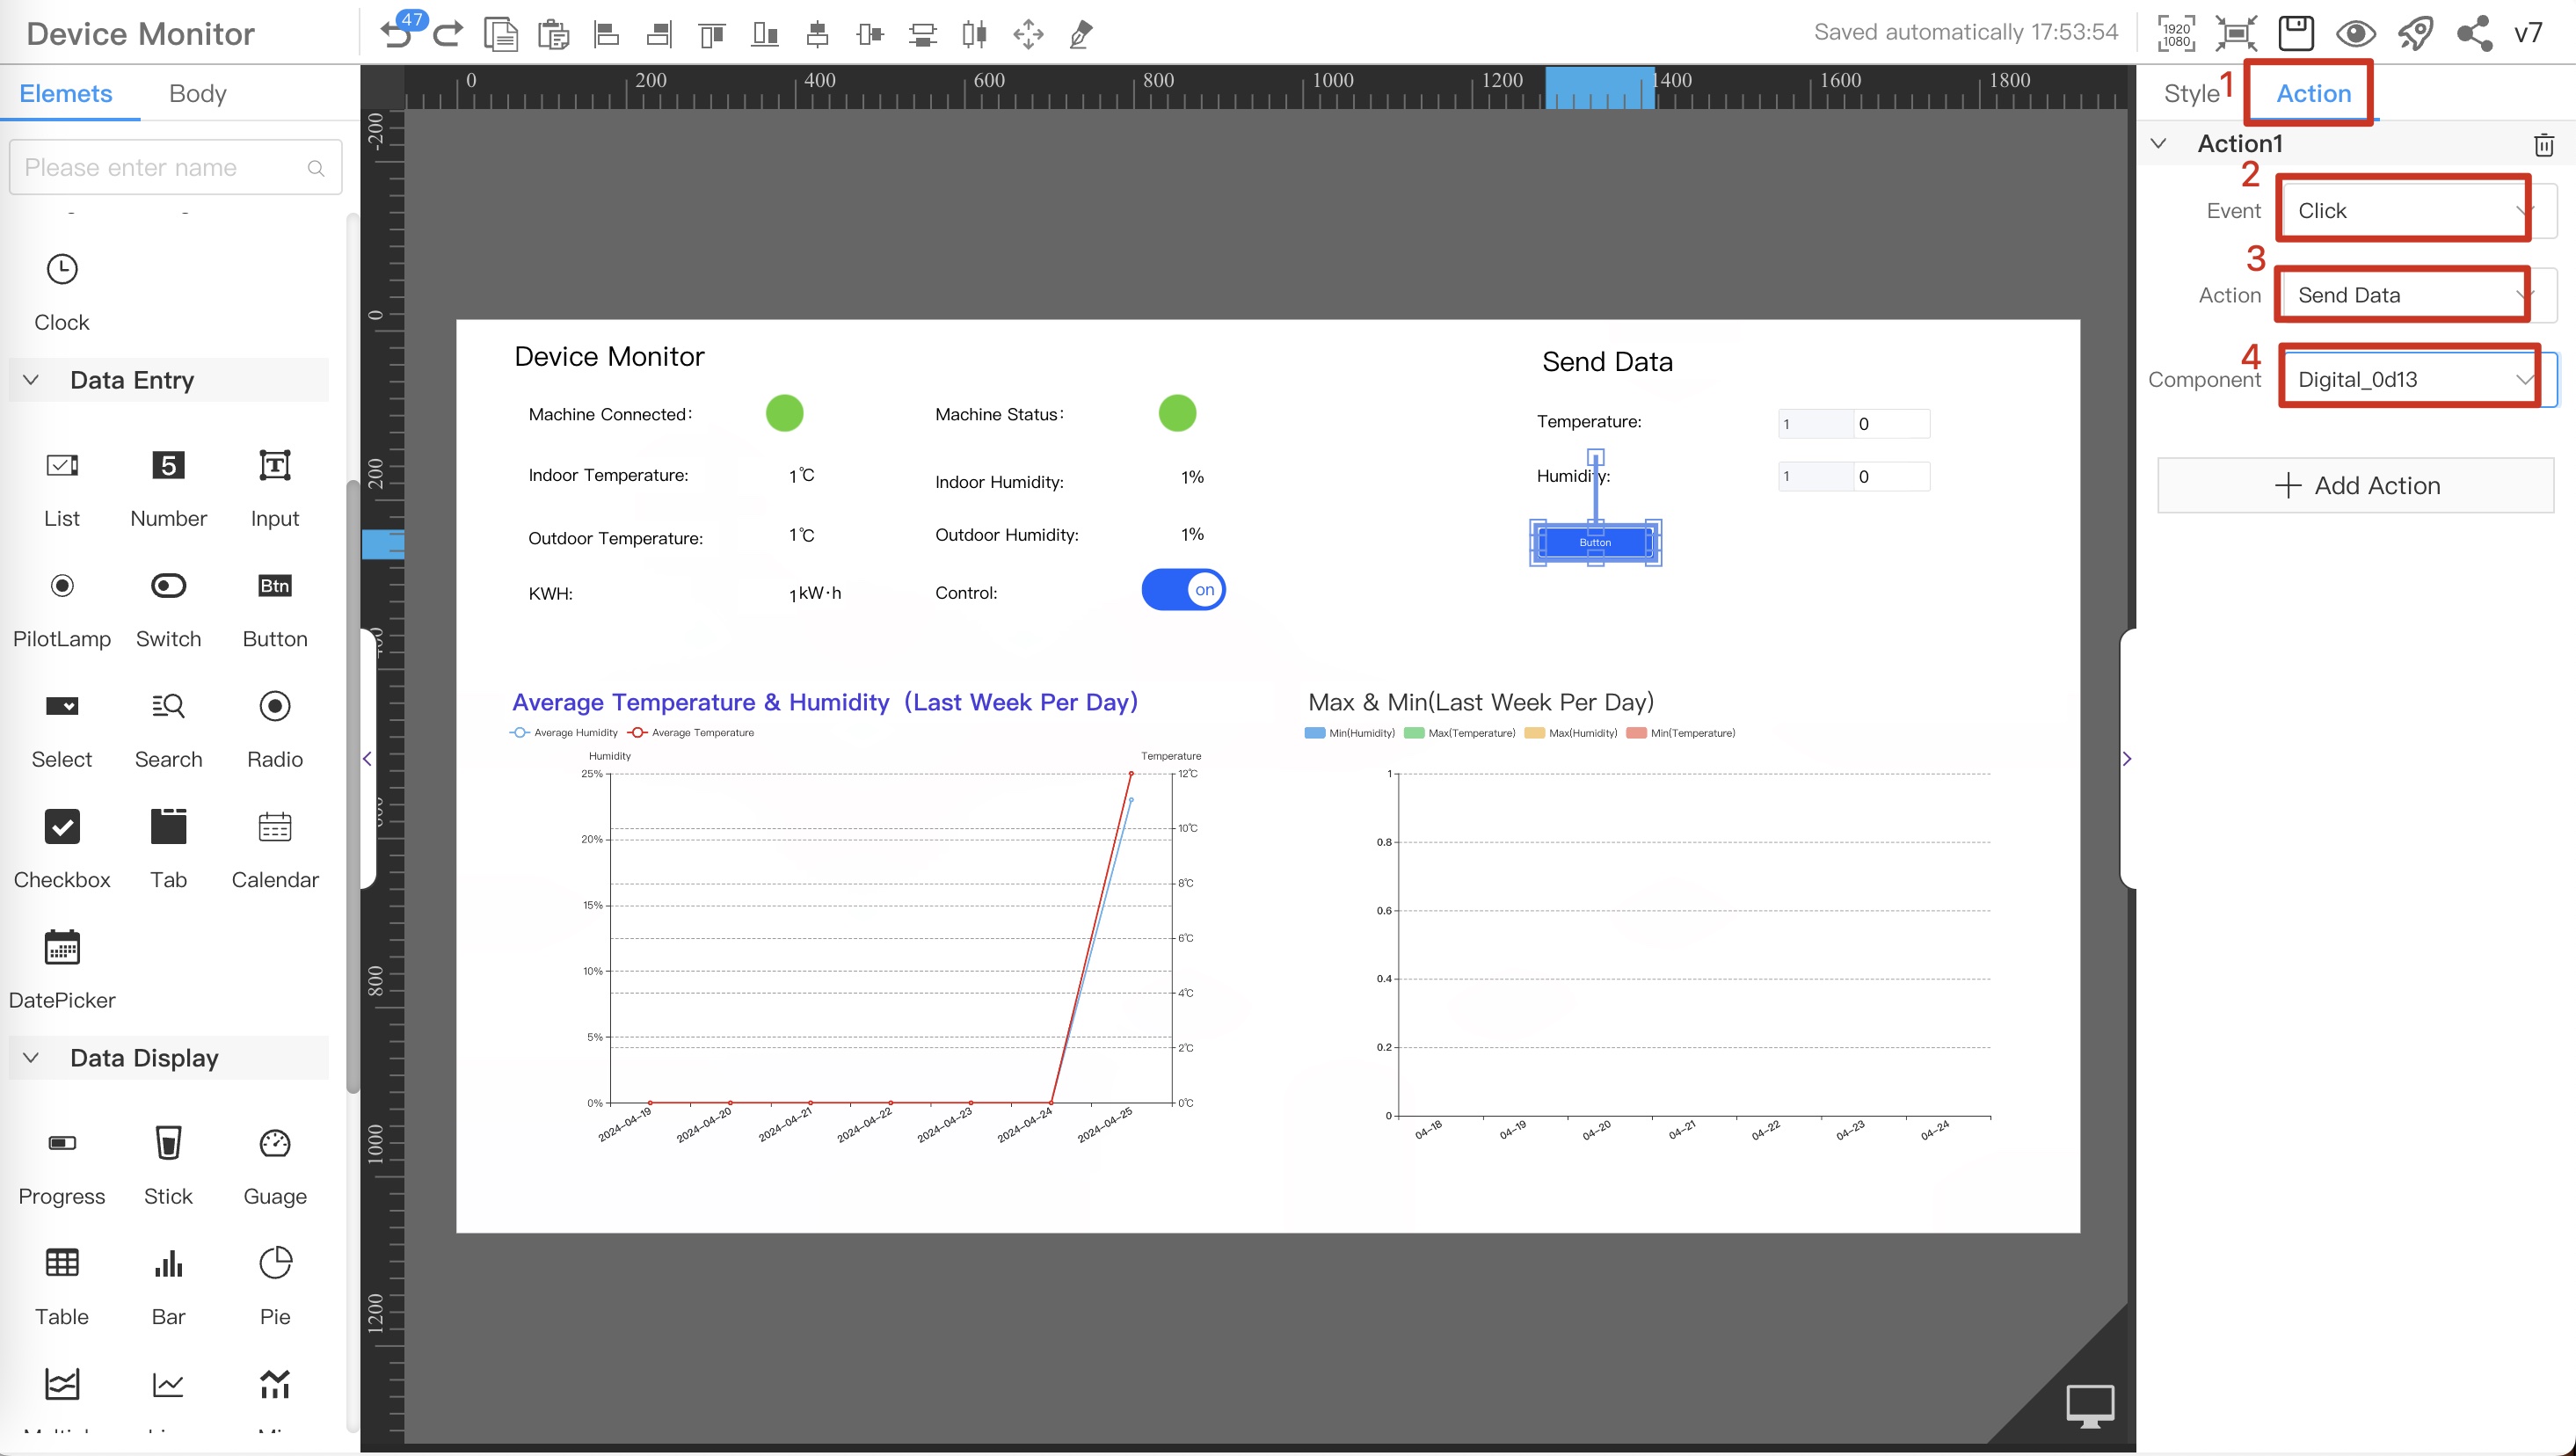
⚠️NoteIf you need to configure more ix parameters for send, please refer to the above steps for configuration. In the final effect presentation, the case configures two ix for send. - Select
5. Display the average temperature and humidity for the past 7 days
This feature requires creating custom data sources first and aggregating historical data.
-
Add a data source
-
1.1. Switch to
Switch Mgmmode, clickDevelop->DataSourcein the left menu to open the data source page, switch to theDevice DataSourcedata source, and click theAddbutton to create a new data source.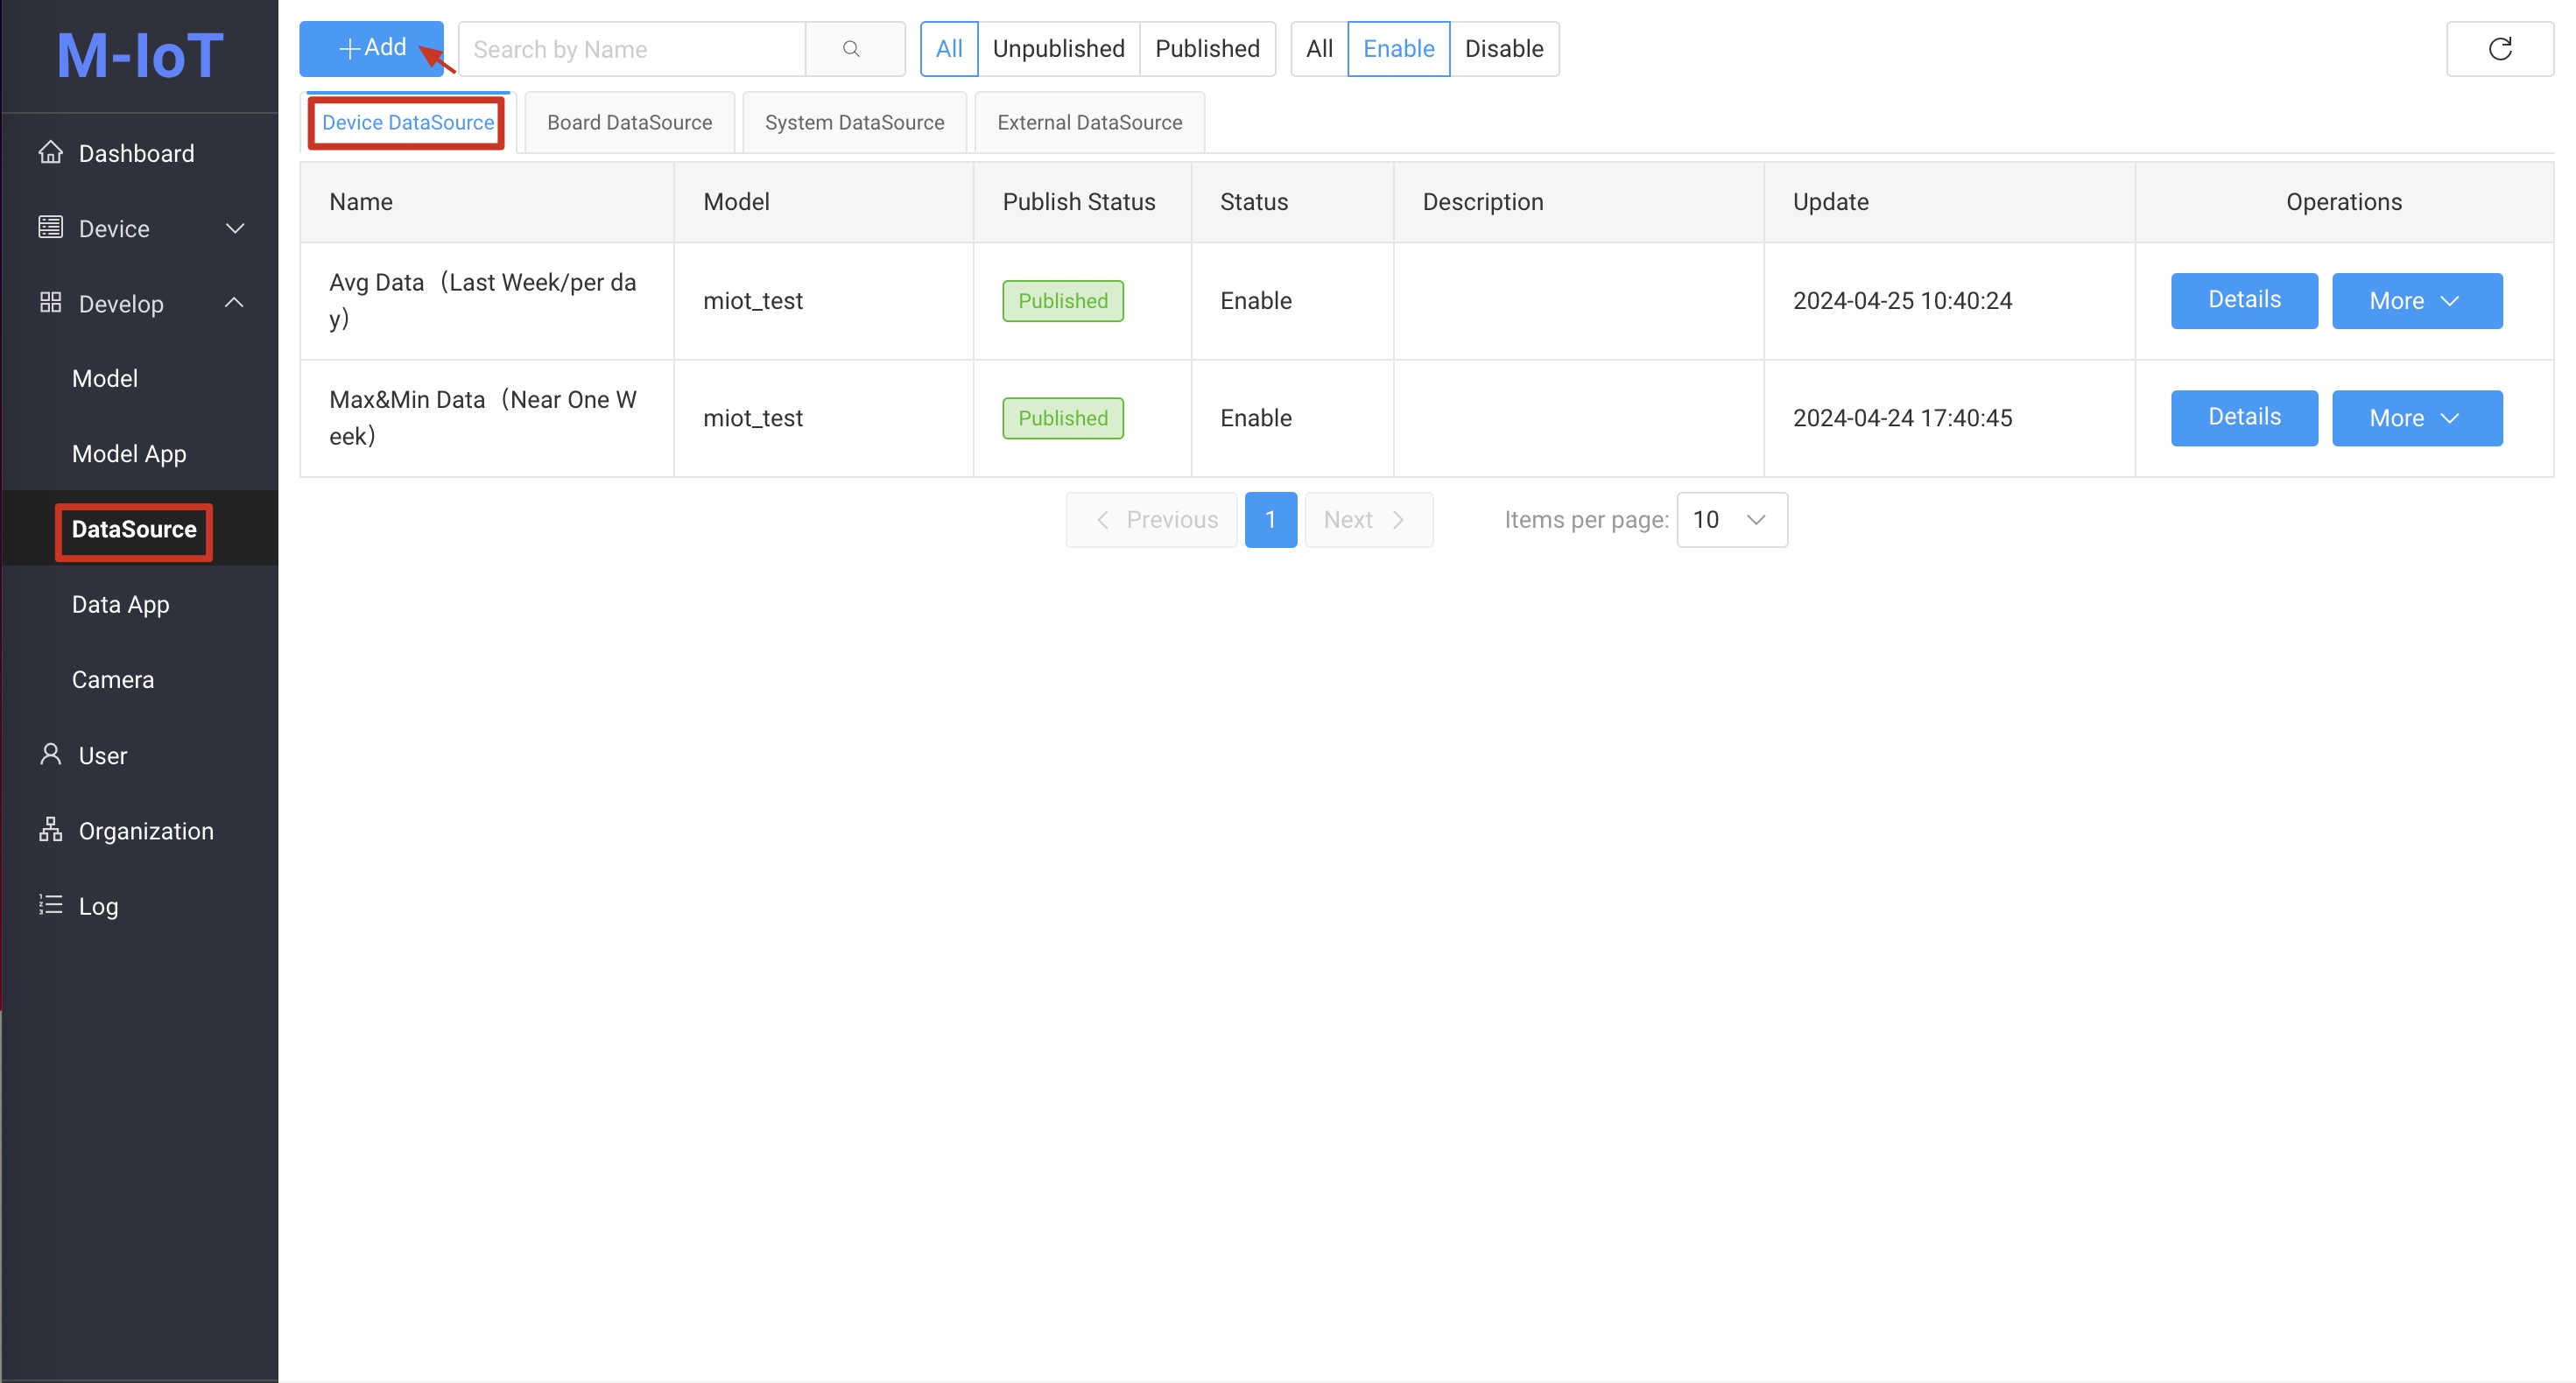
-
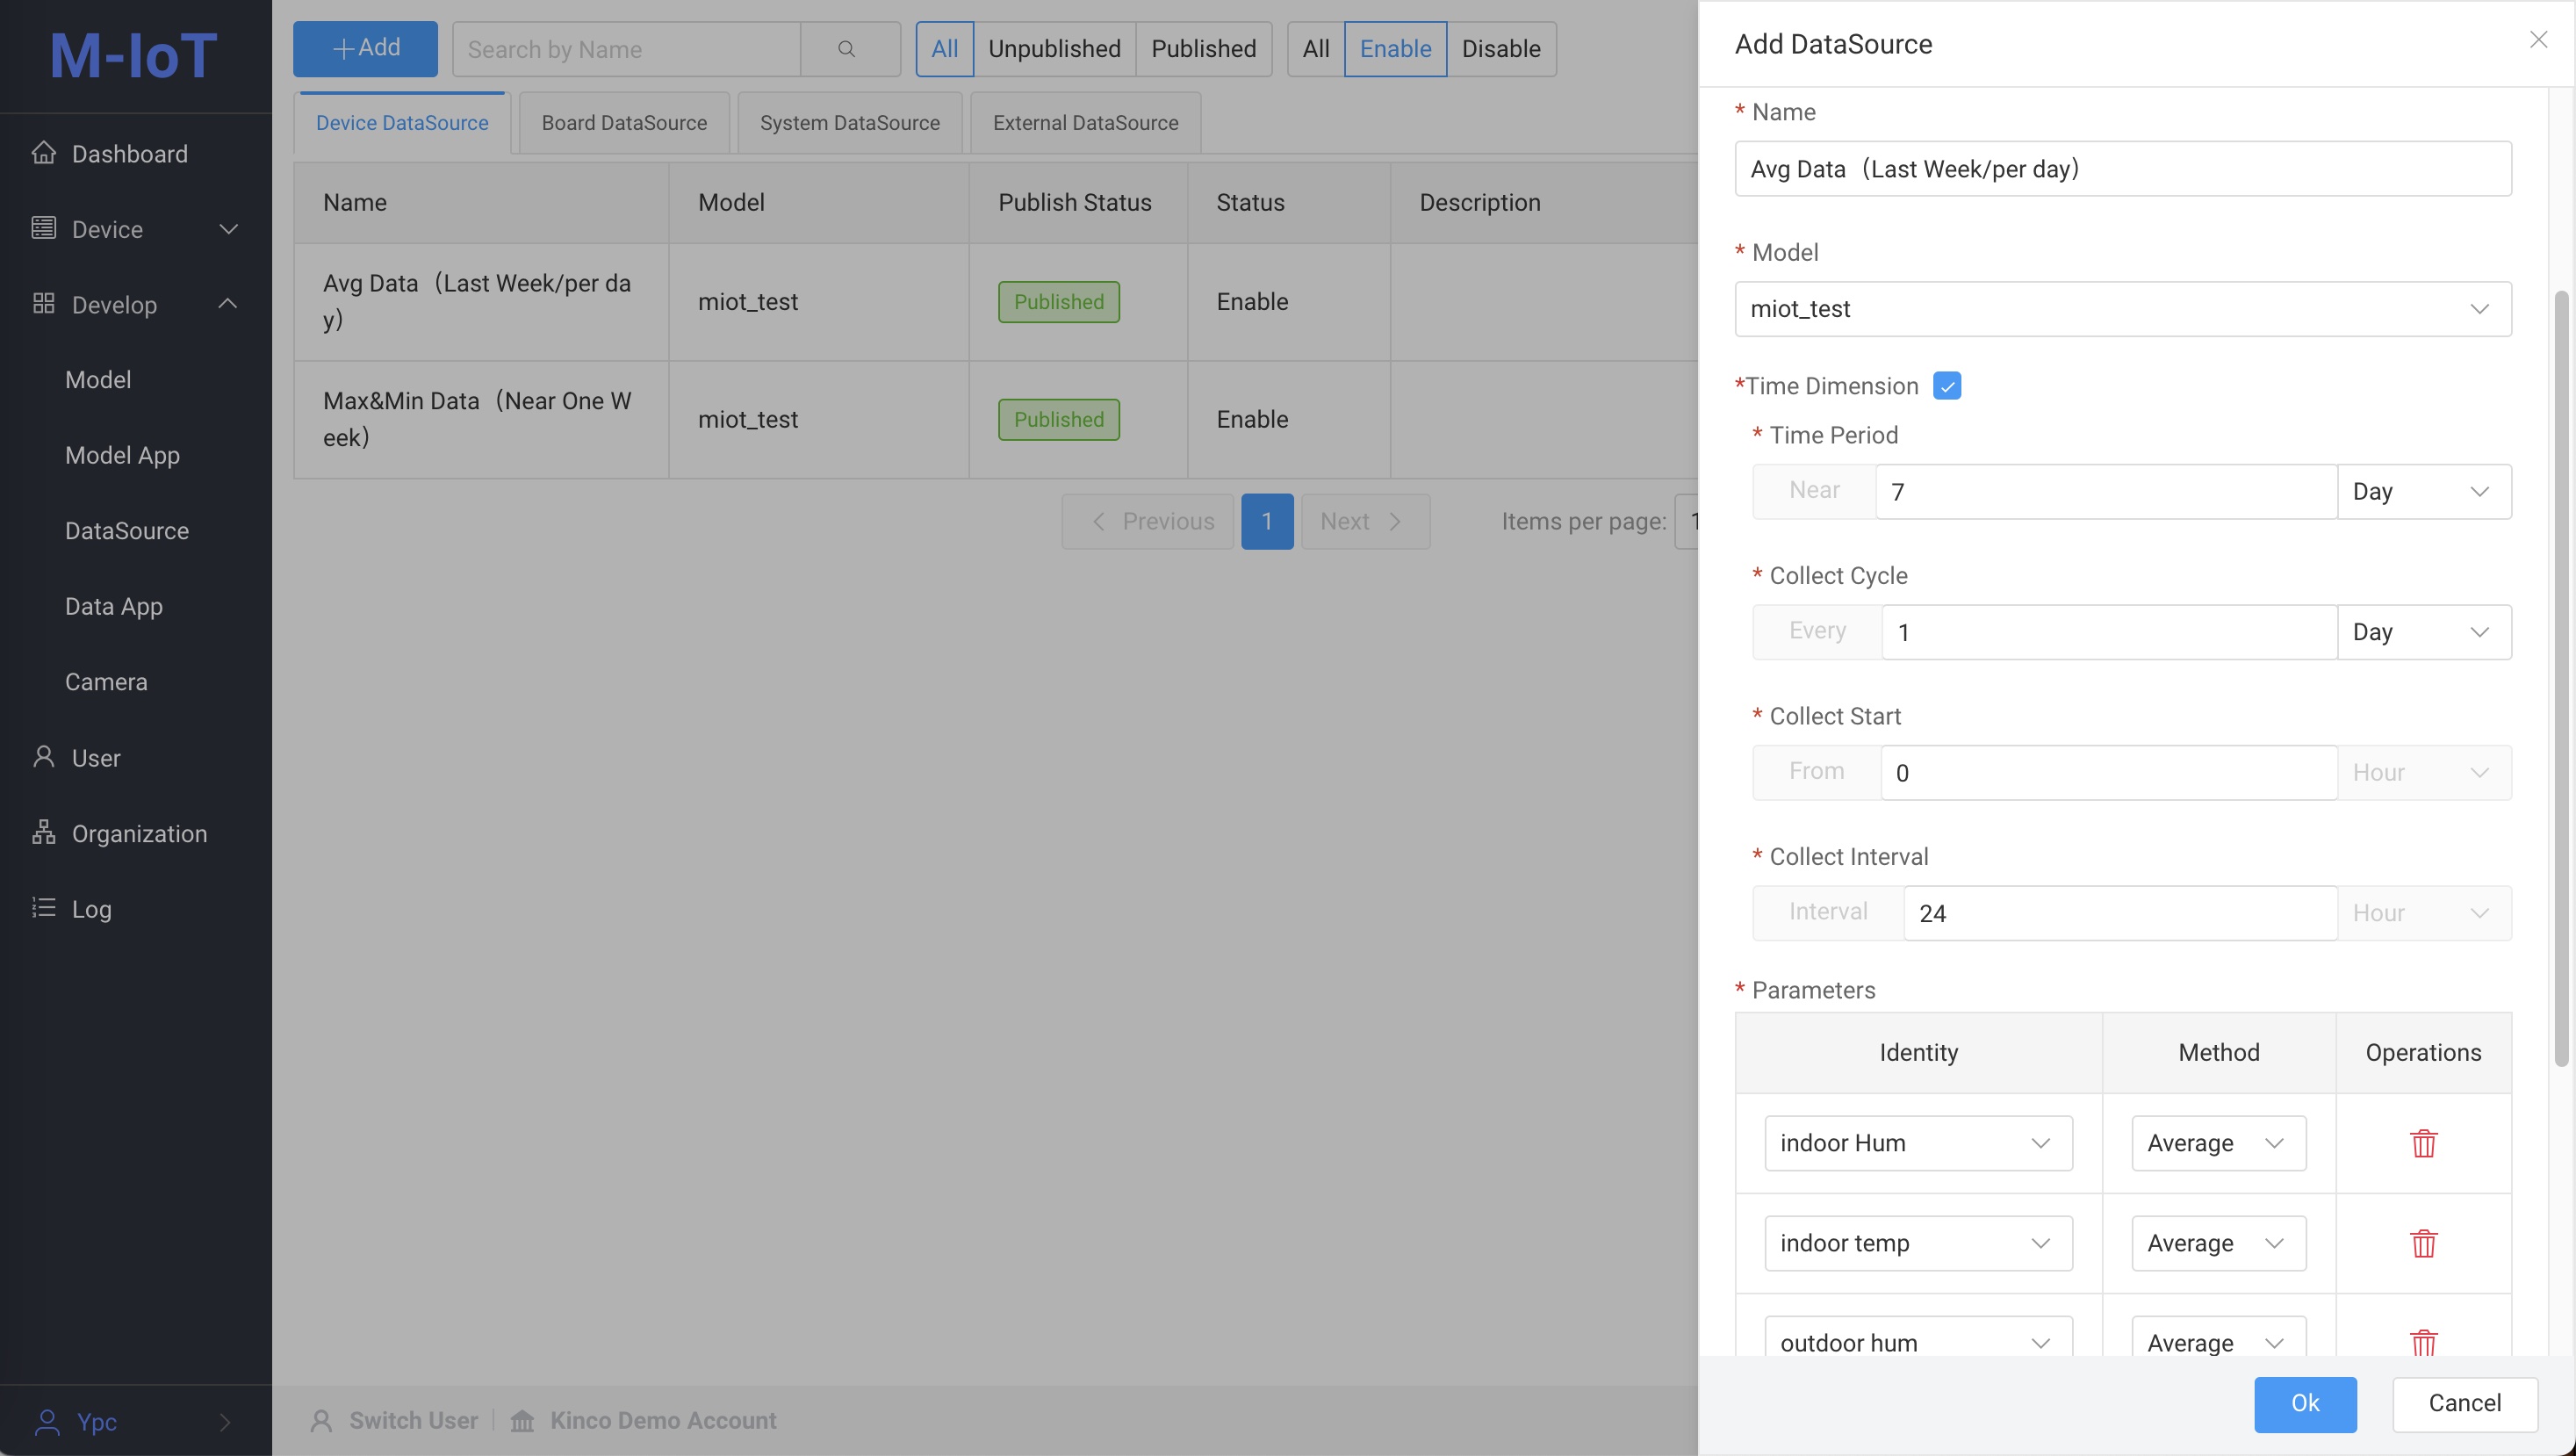
Time dimension: Click the radio button after the time dimension to pop up the time dimension parameters
-
Time period: Statistics for the past 7 days
-
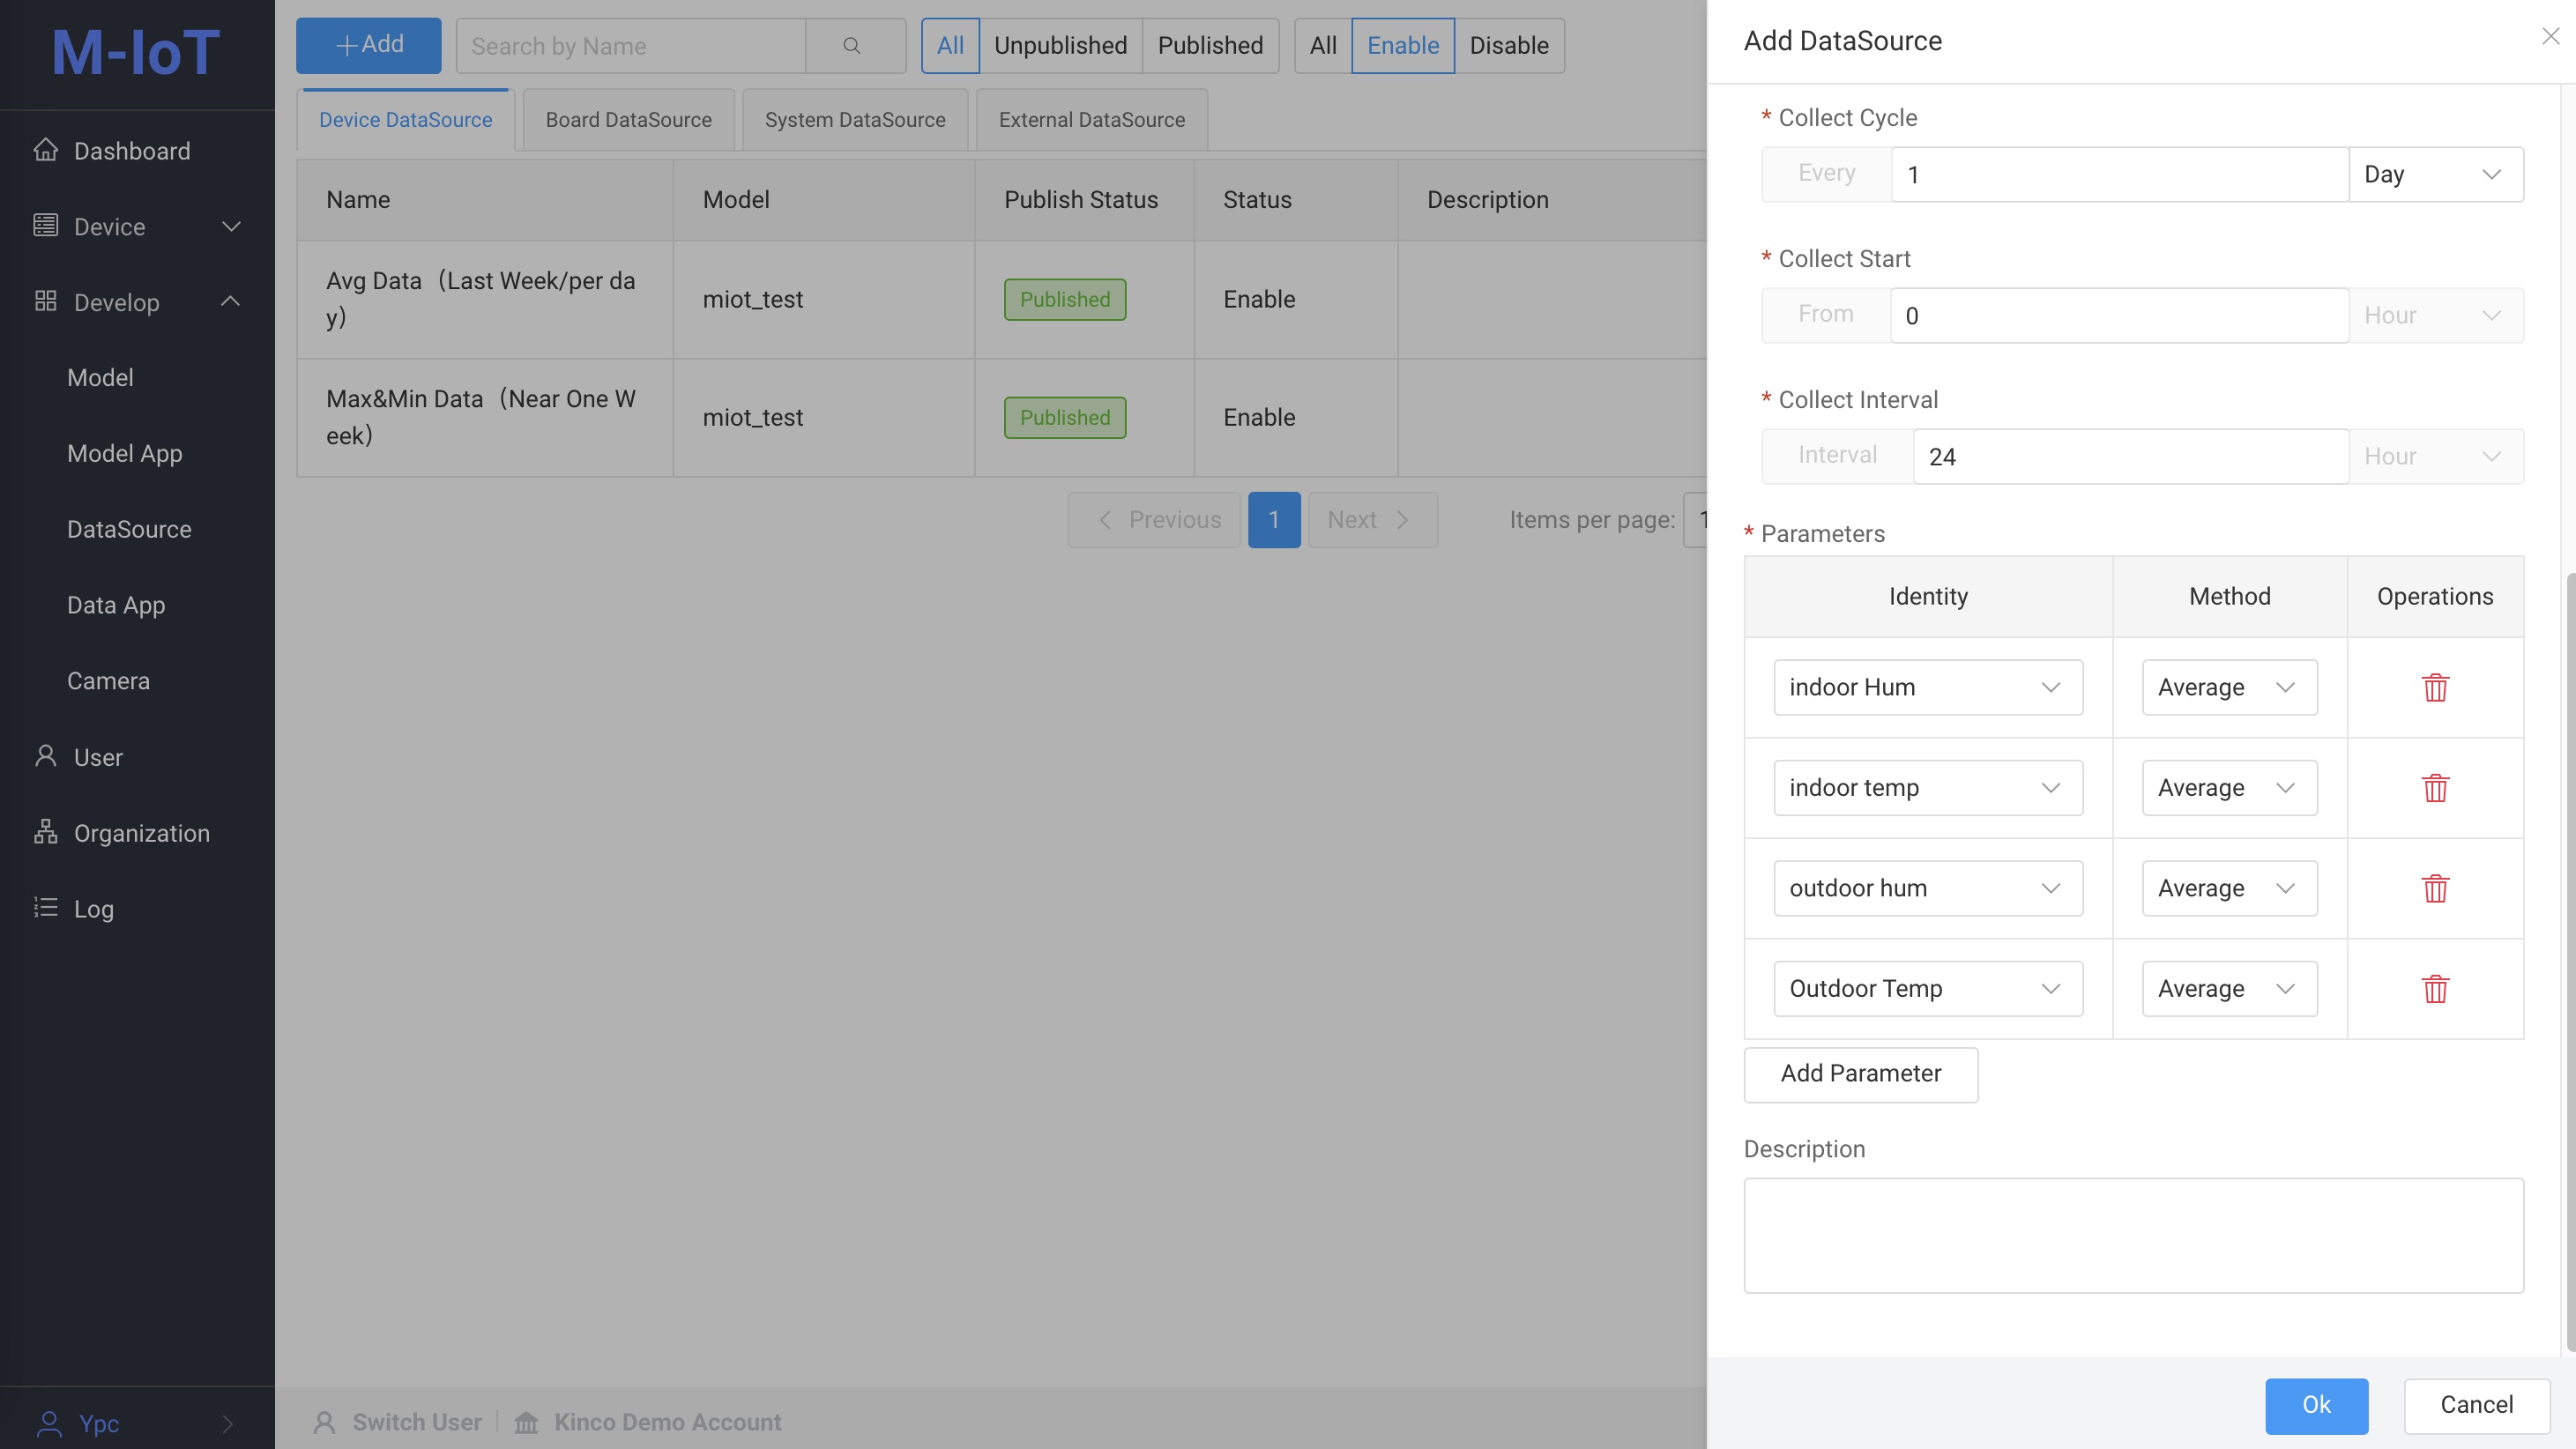
Collection cycle: once a day
-
Collection start and collection interval: Statistics on the average temperature and humidity from 0:00 to 24:00 every day. Fill in according to the actual situation. For example, if the effective statistical time is from 8:00 am to 18:00 pm every day, fill in 8 and 10 respectively
-
Parameters: Click the Add Parameter button to add four parameters, namely:
- Identity is
indoor Hum, Method isAverage. - Identity is
indoor temp, Method isAverage. - Identity is
outdoor hum, Method isAverage. - Identity is
Outdoor Temp, Method isAverage.
After filling in the information, click the
Okbutton to save the data source. - Identity is
-
-
1.2 Select
Output TypeasObject Arrayand clickOK.⚠️NoteAccording to the returned sample, select the appropriate component, please refer to output type data sample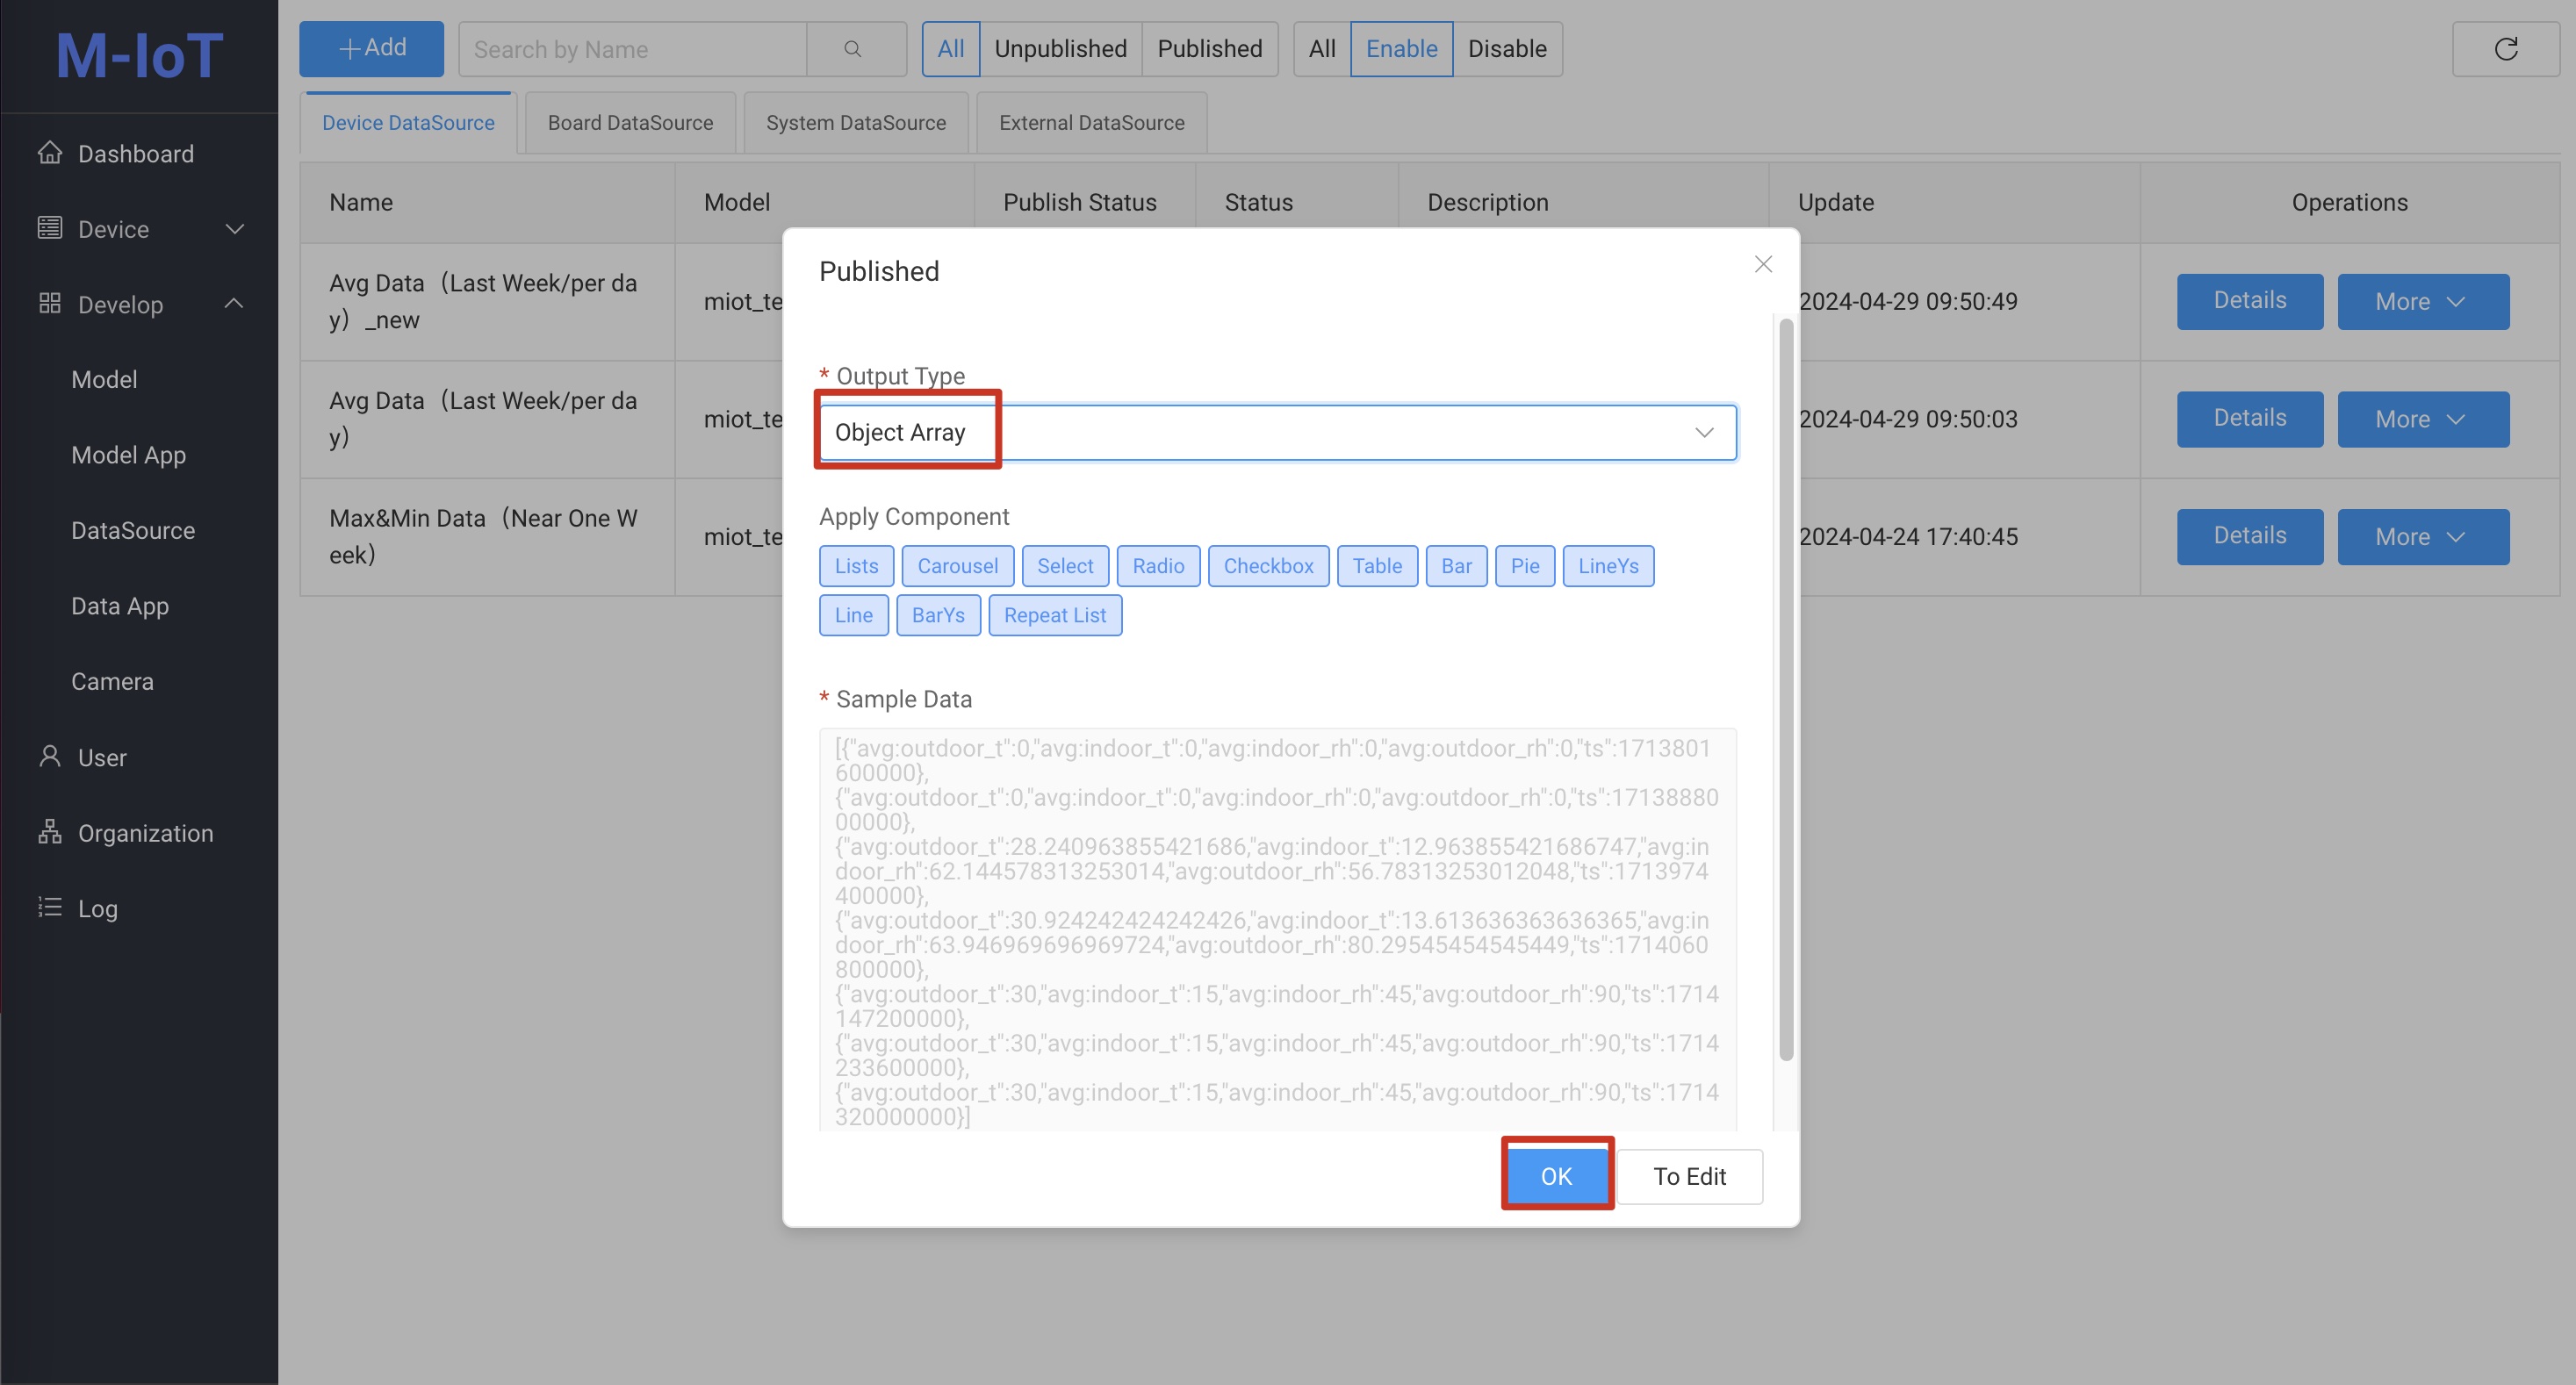
-
-
Visual page design
-
2.1 From the component library on the left, select the
Multiplecomponent and drag it into the canvas.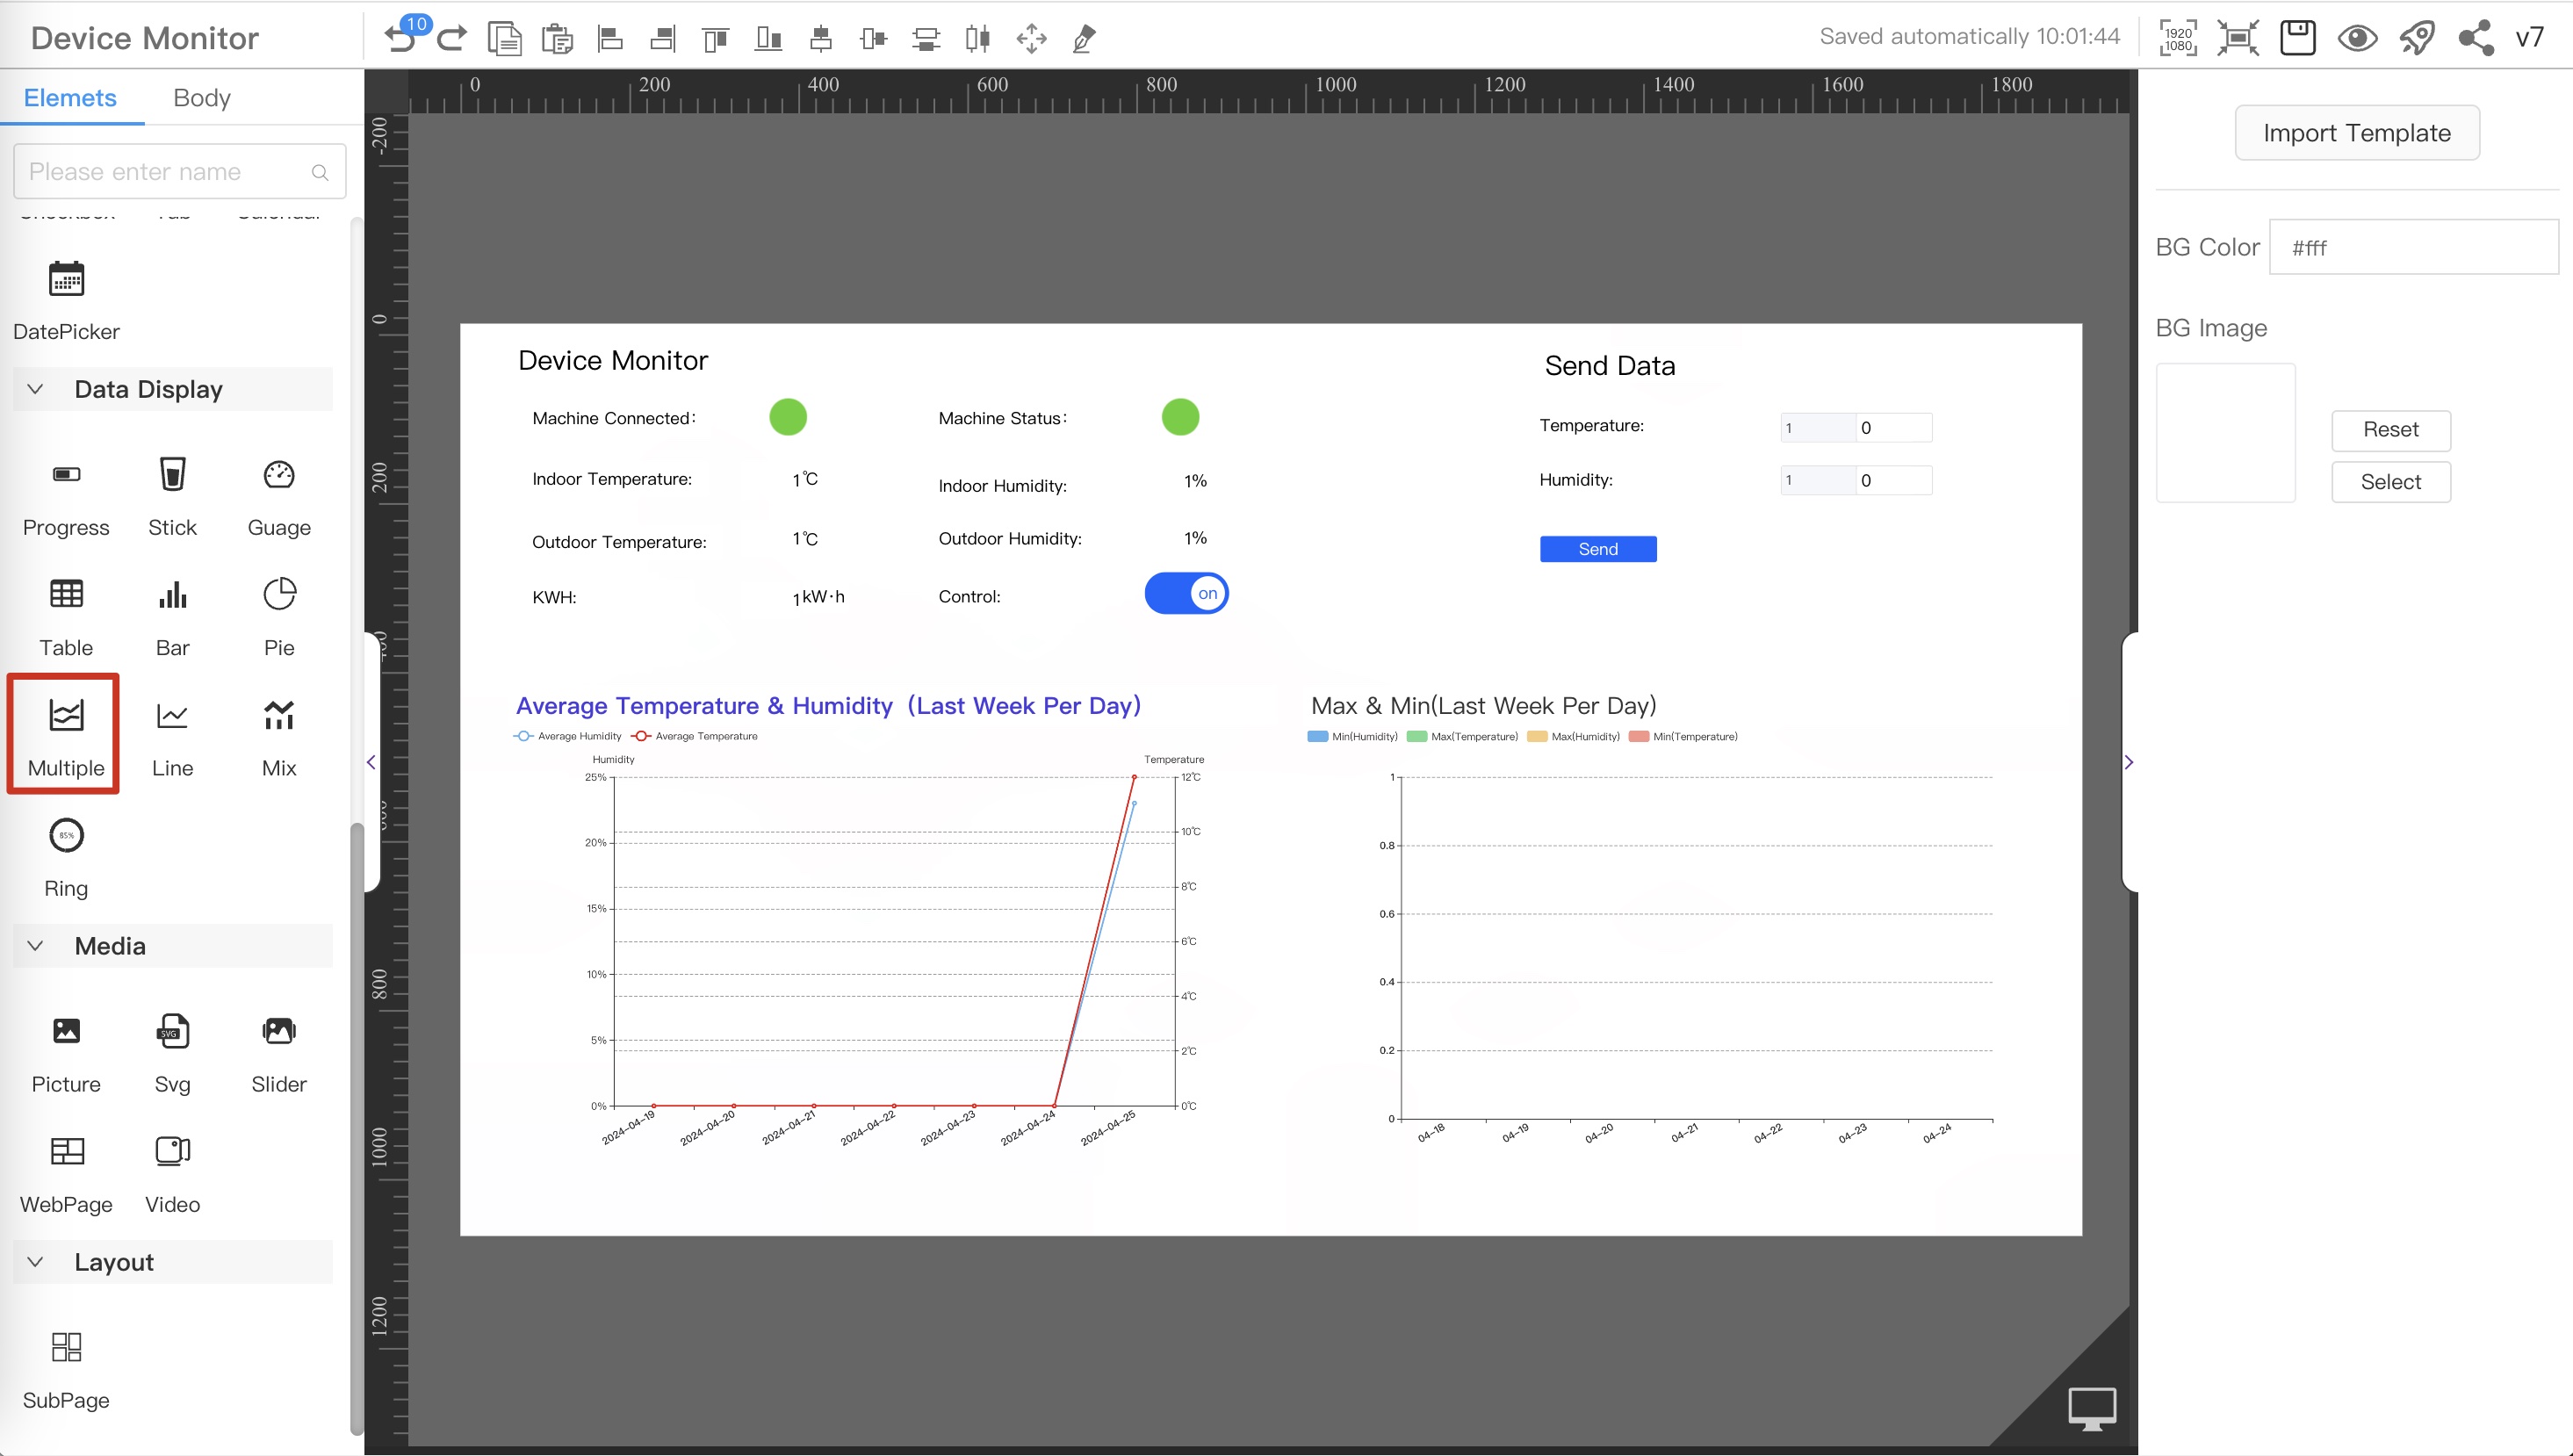
-
2.2 Select the dragged component, in the style
Data Sourceconfiguration item on the right, click theConfigbutton to configure the data source.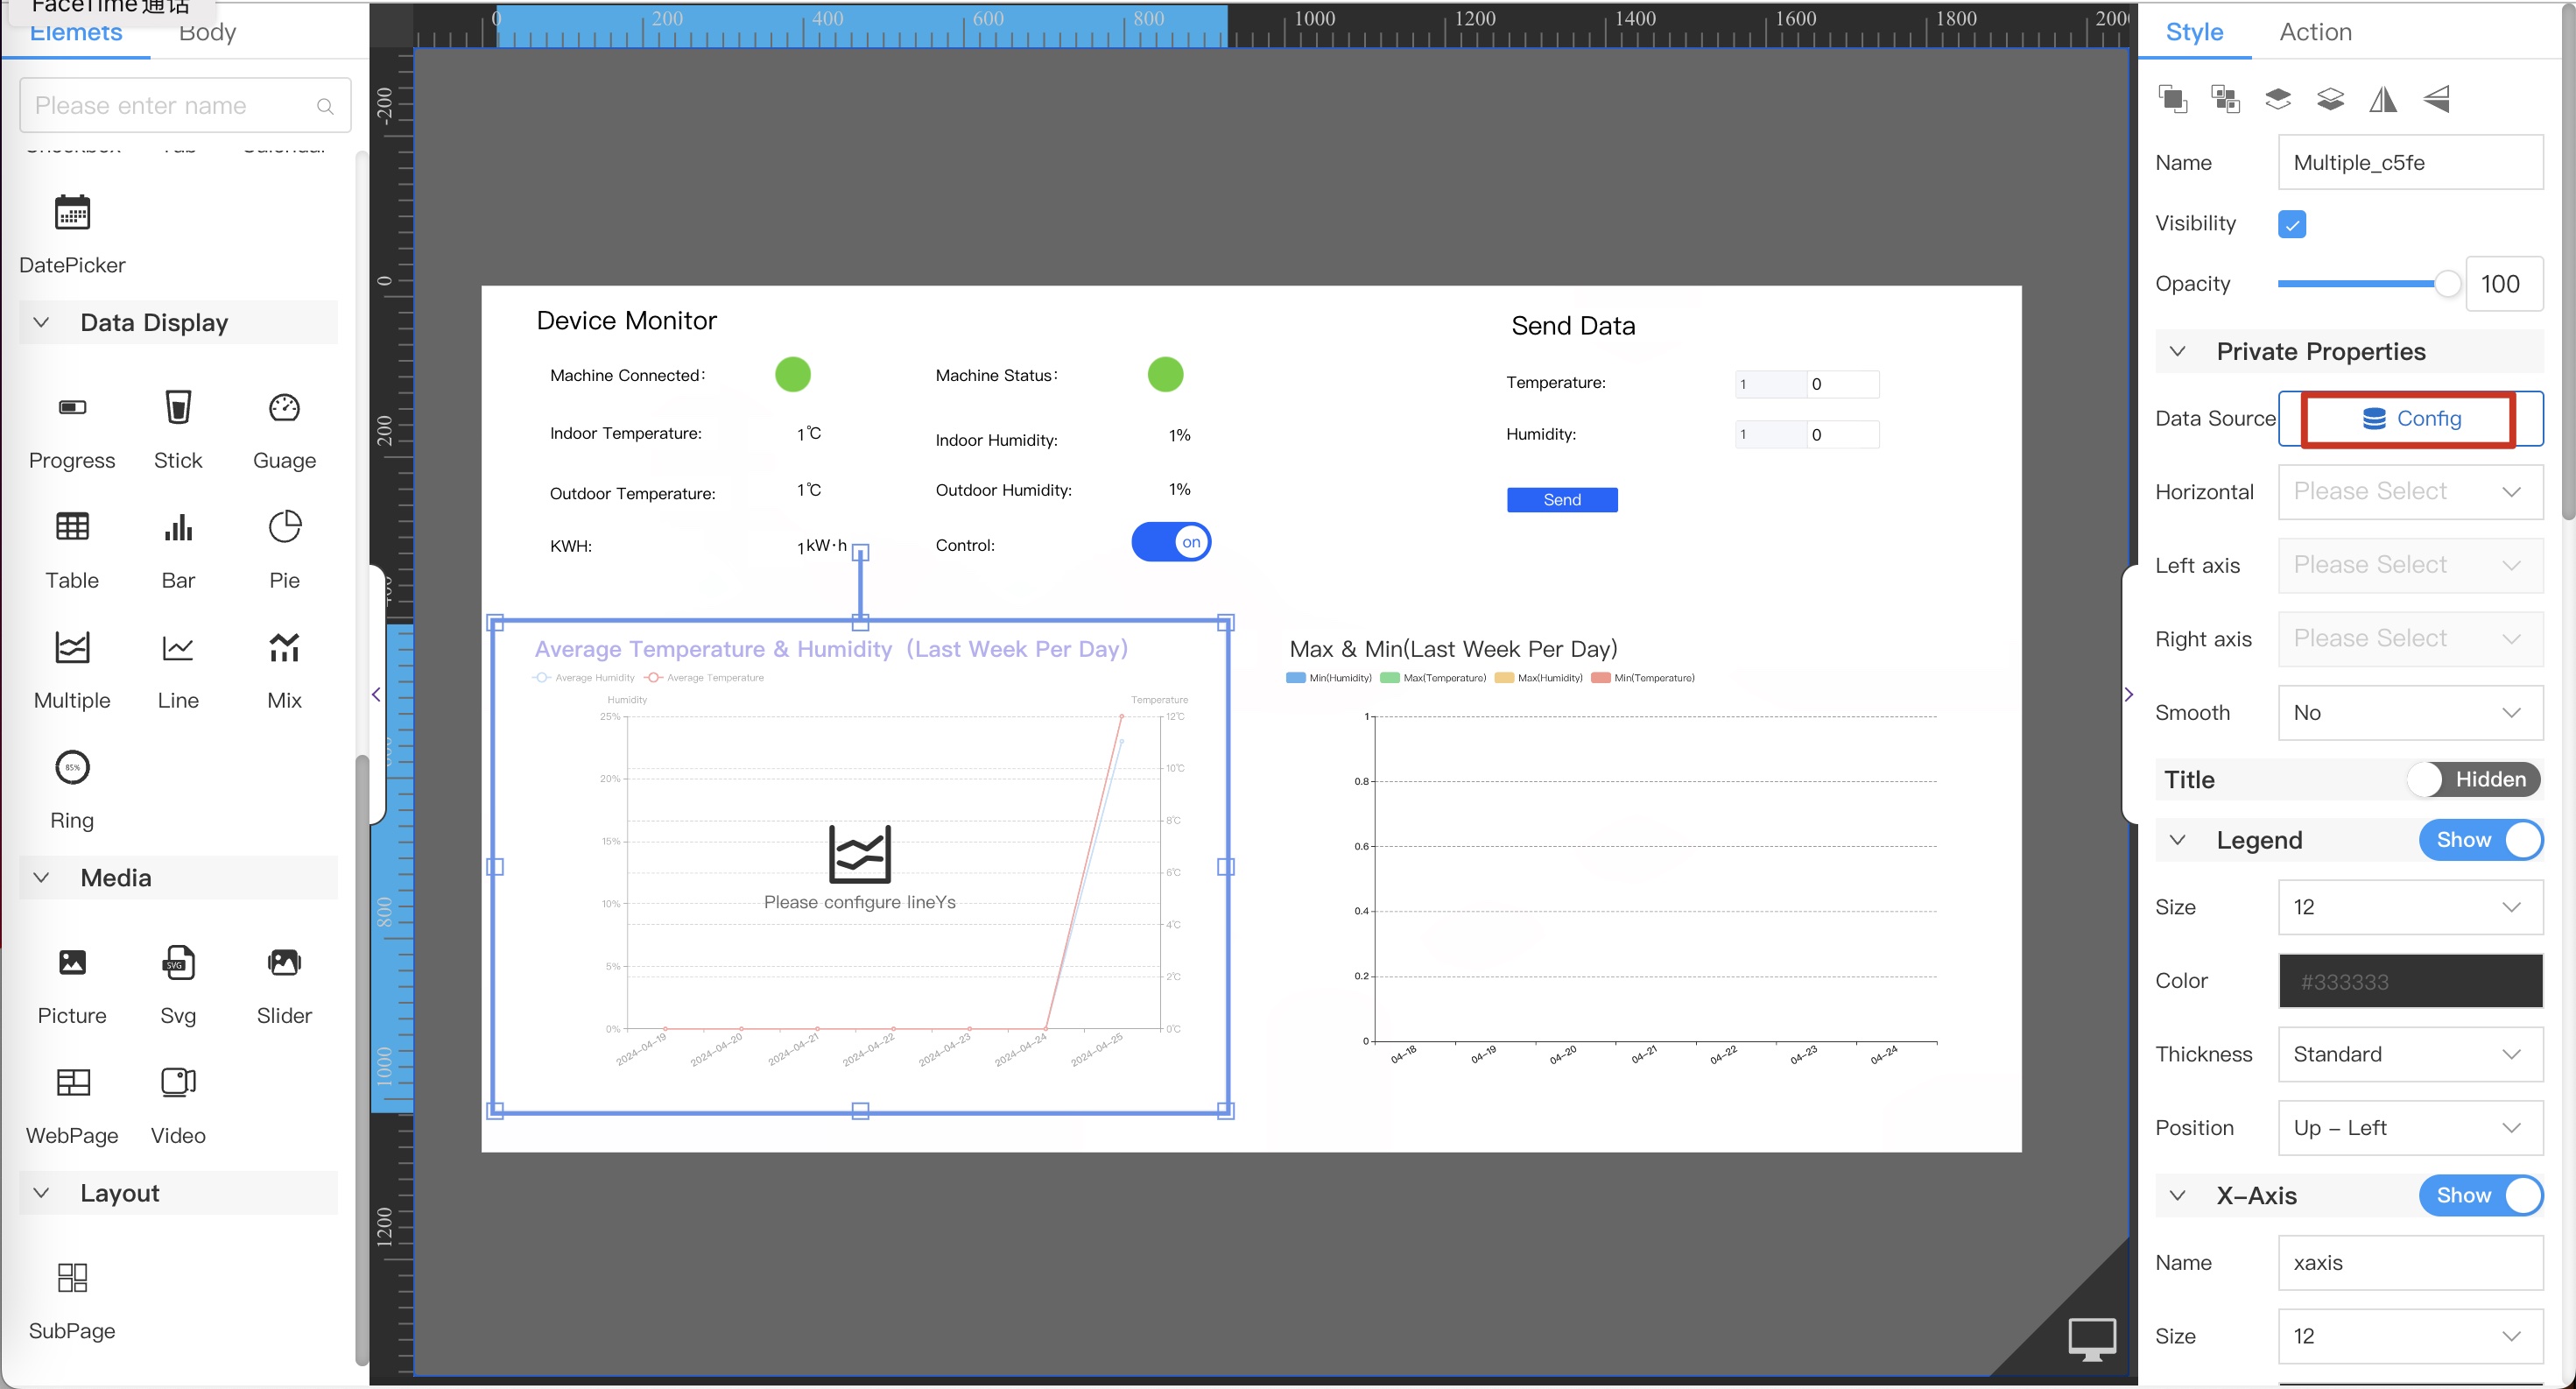
-
2.3 The data source config popup, configure the device parameters to be monitored, refer to the sequence number in the figure below
- Select the
Interfacedata source - Select the
Customtype data source - Select the
Avg Data (Last Week/per day)_newdata source
⚠️NoteSelect the data source you just created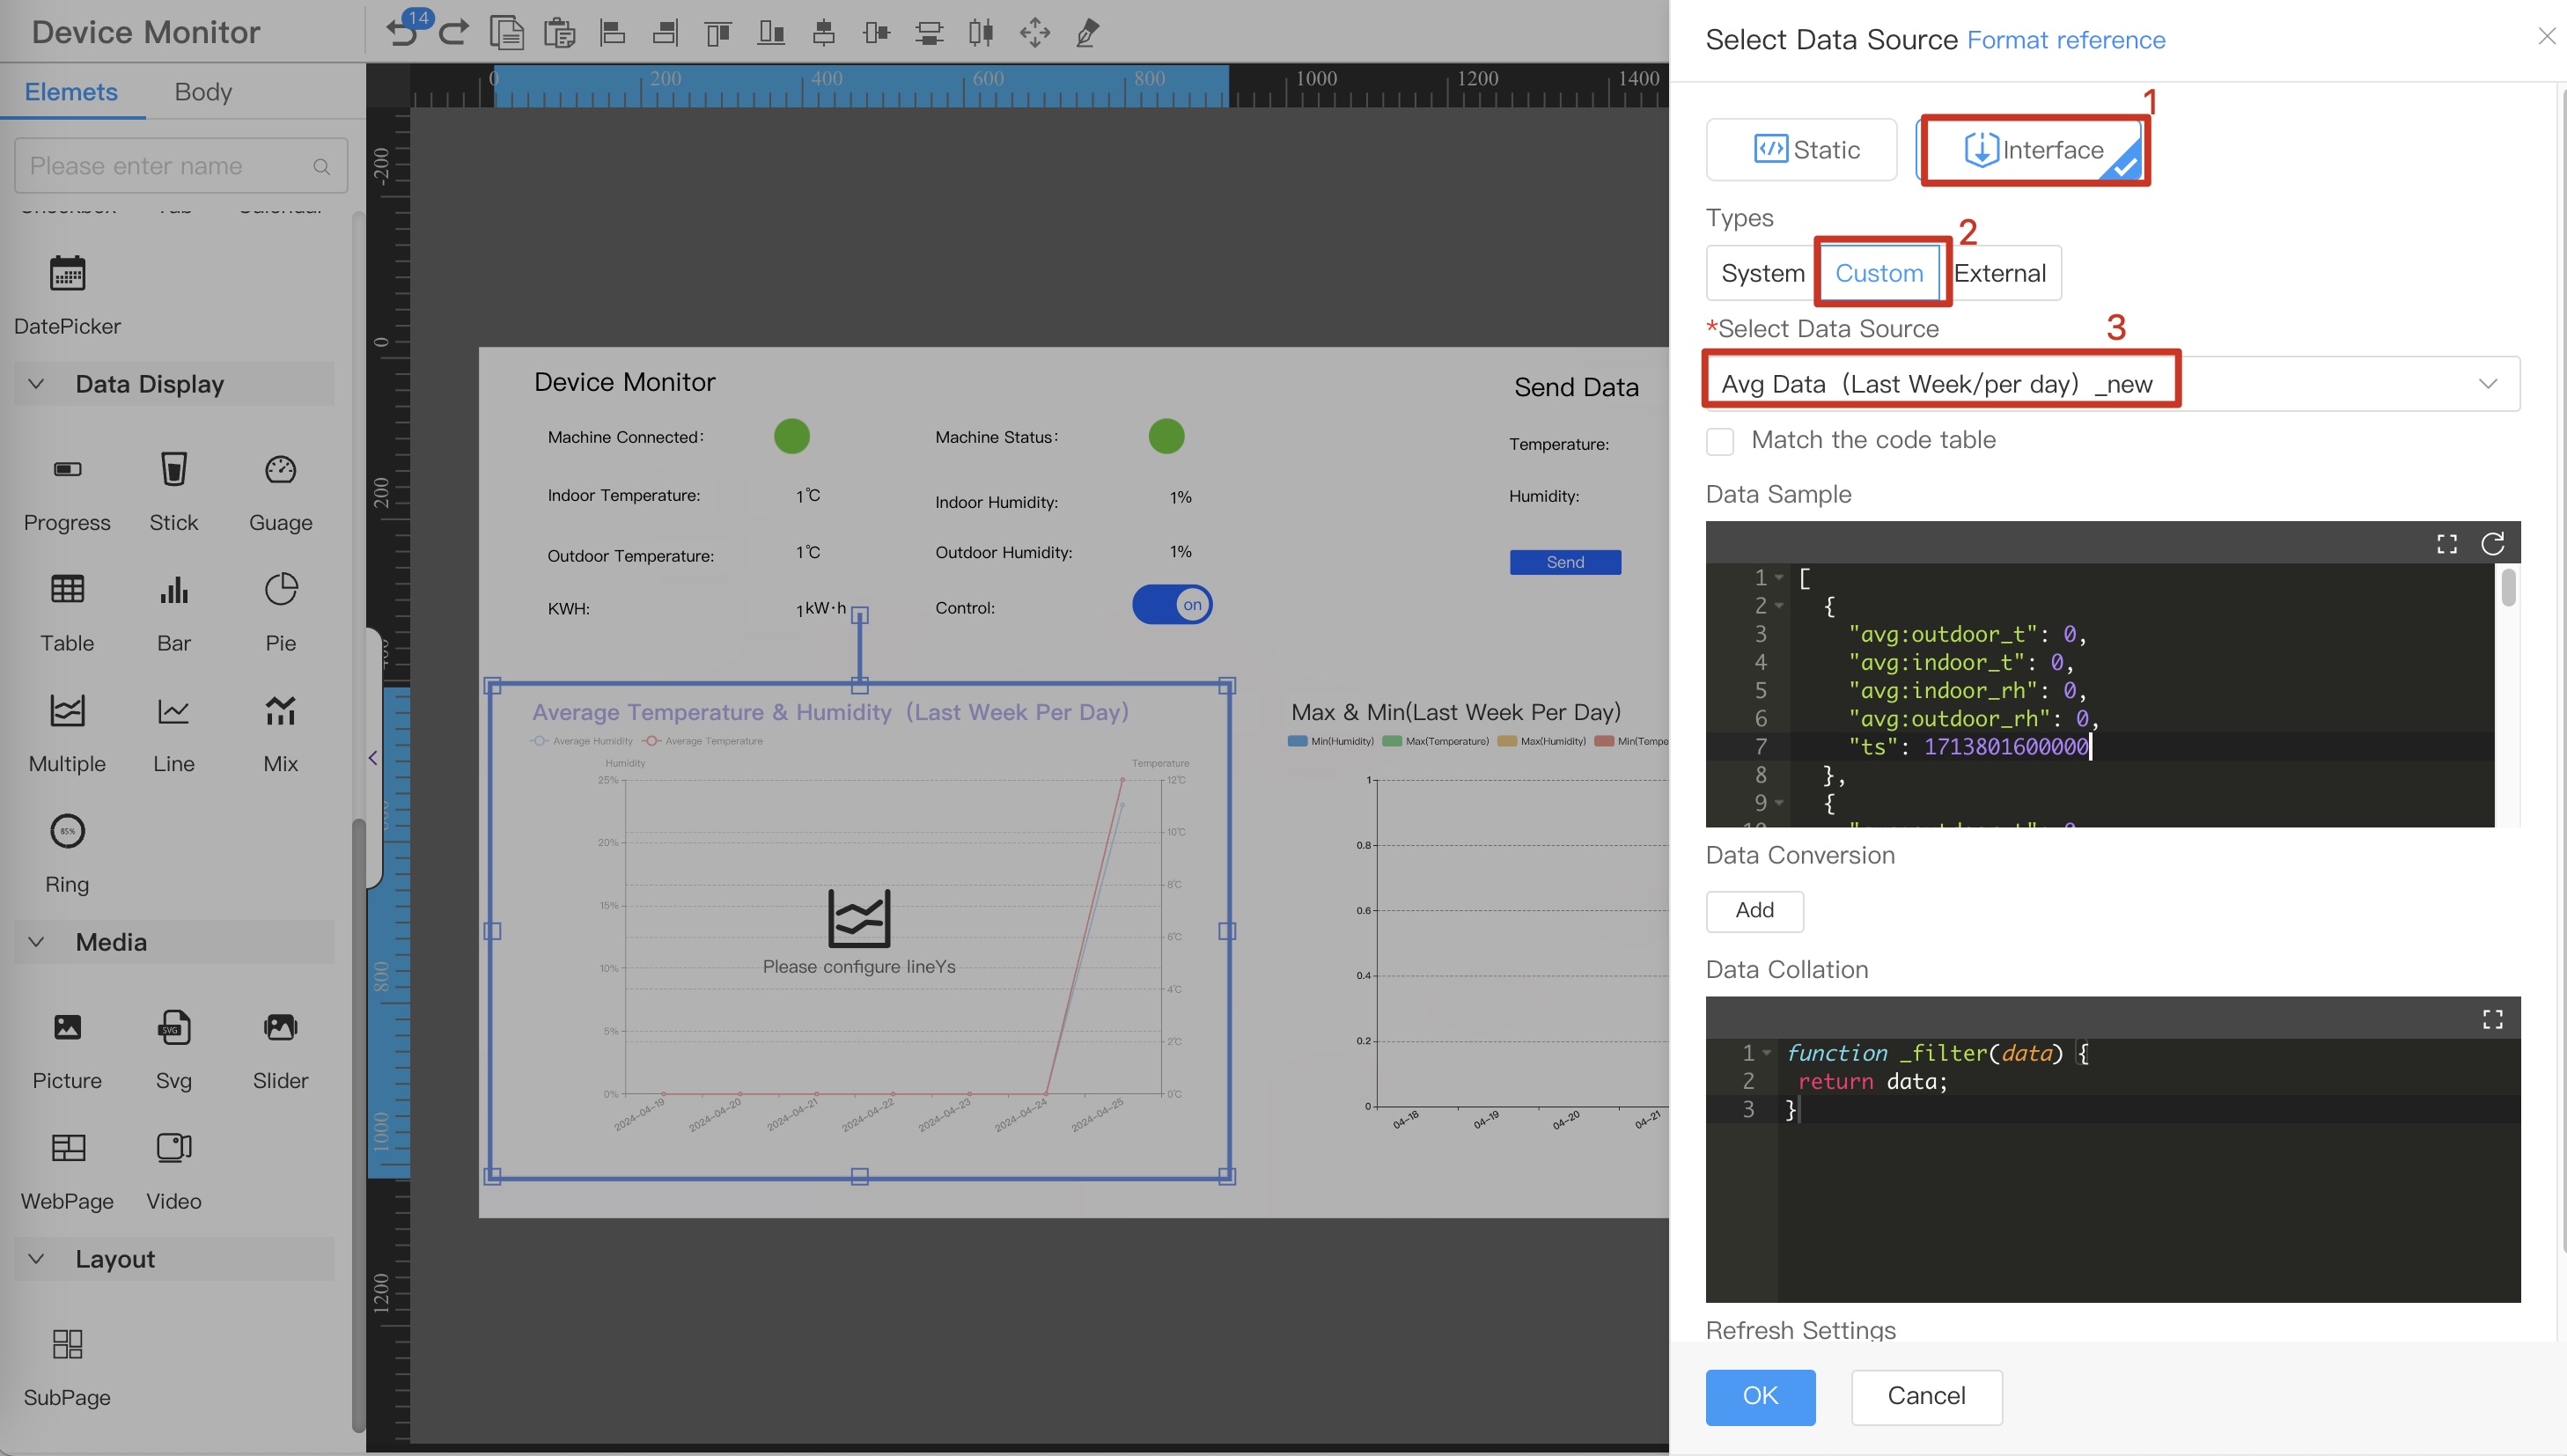
- Select the
-
2.4 Format the data source time display format
⚠️Note-
Only fields with field name
tscan be formatted -
Standardis selected according to specific needs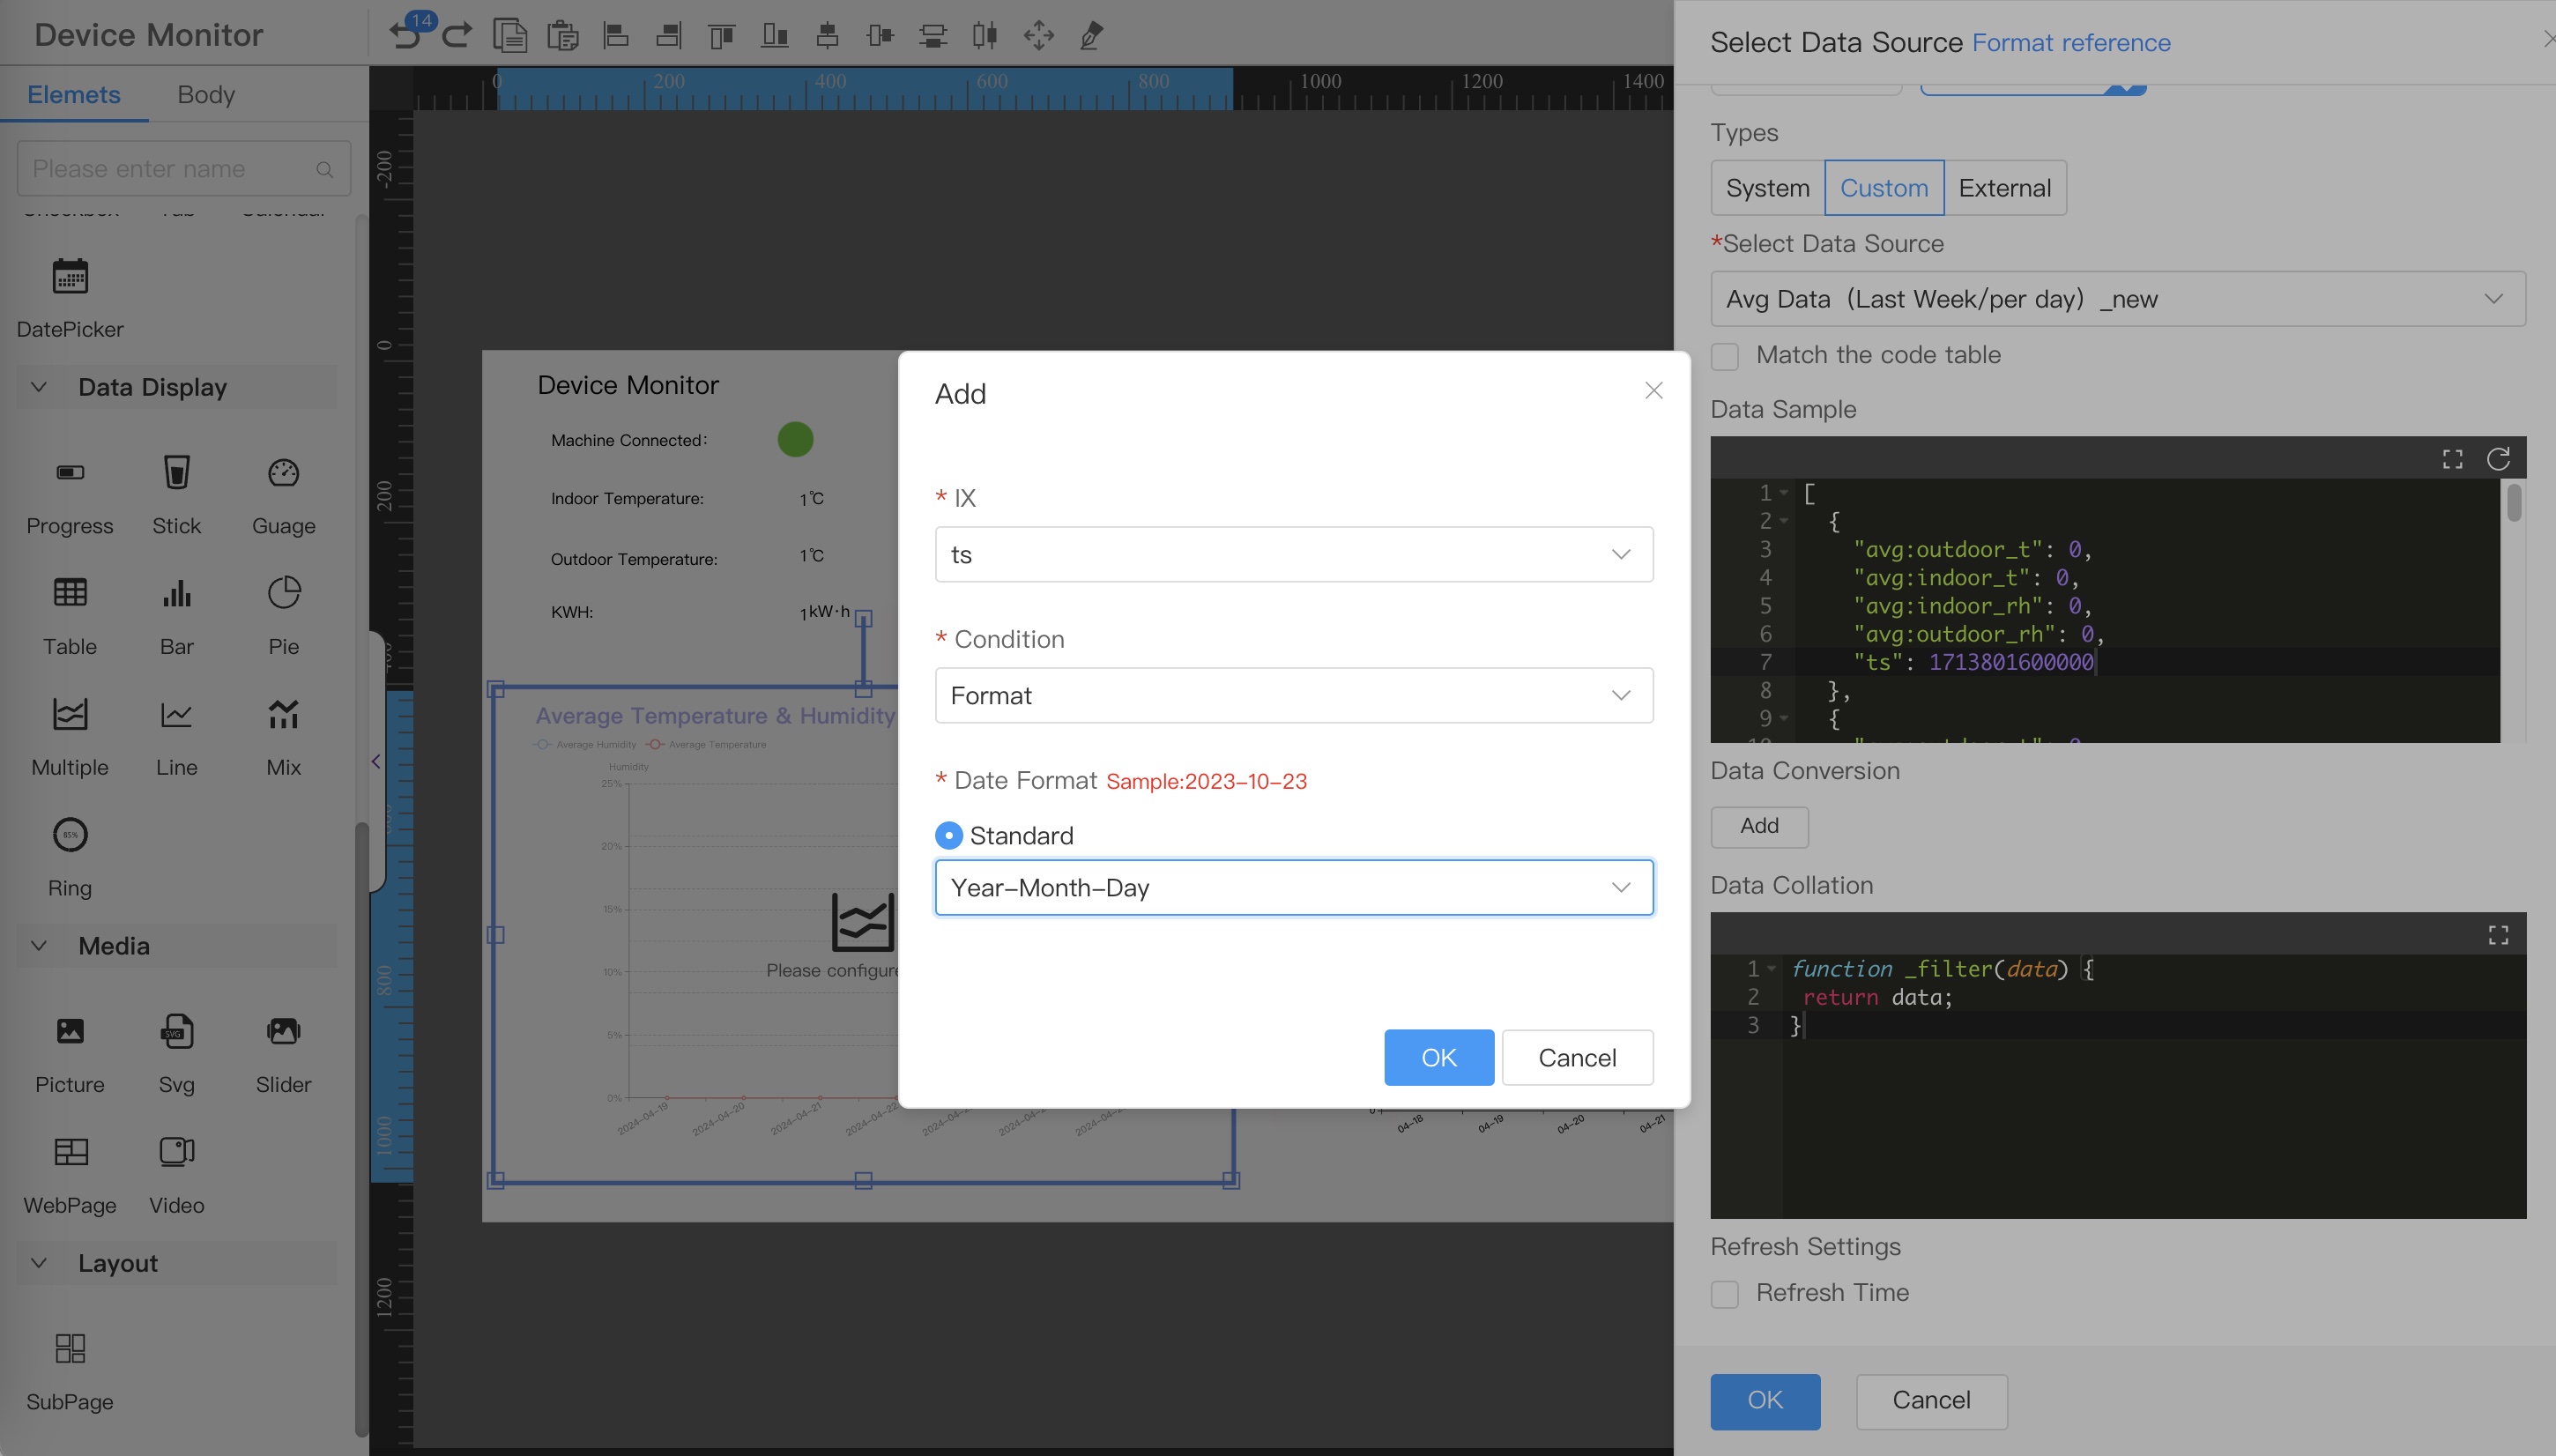
-
-
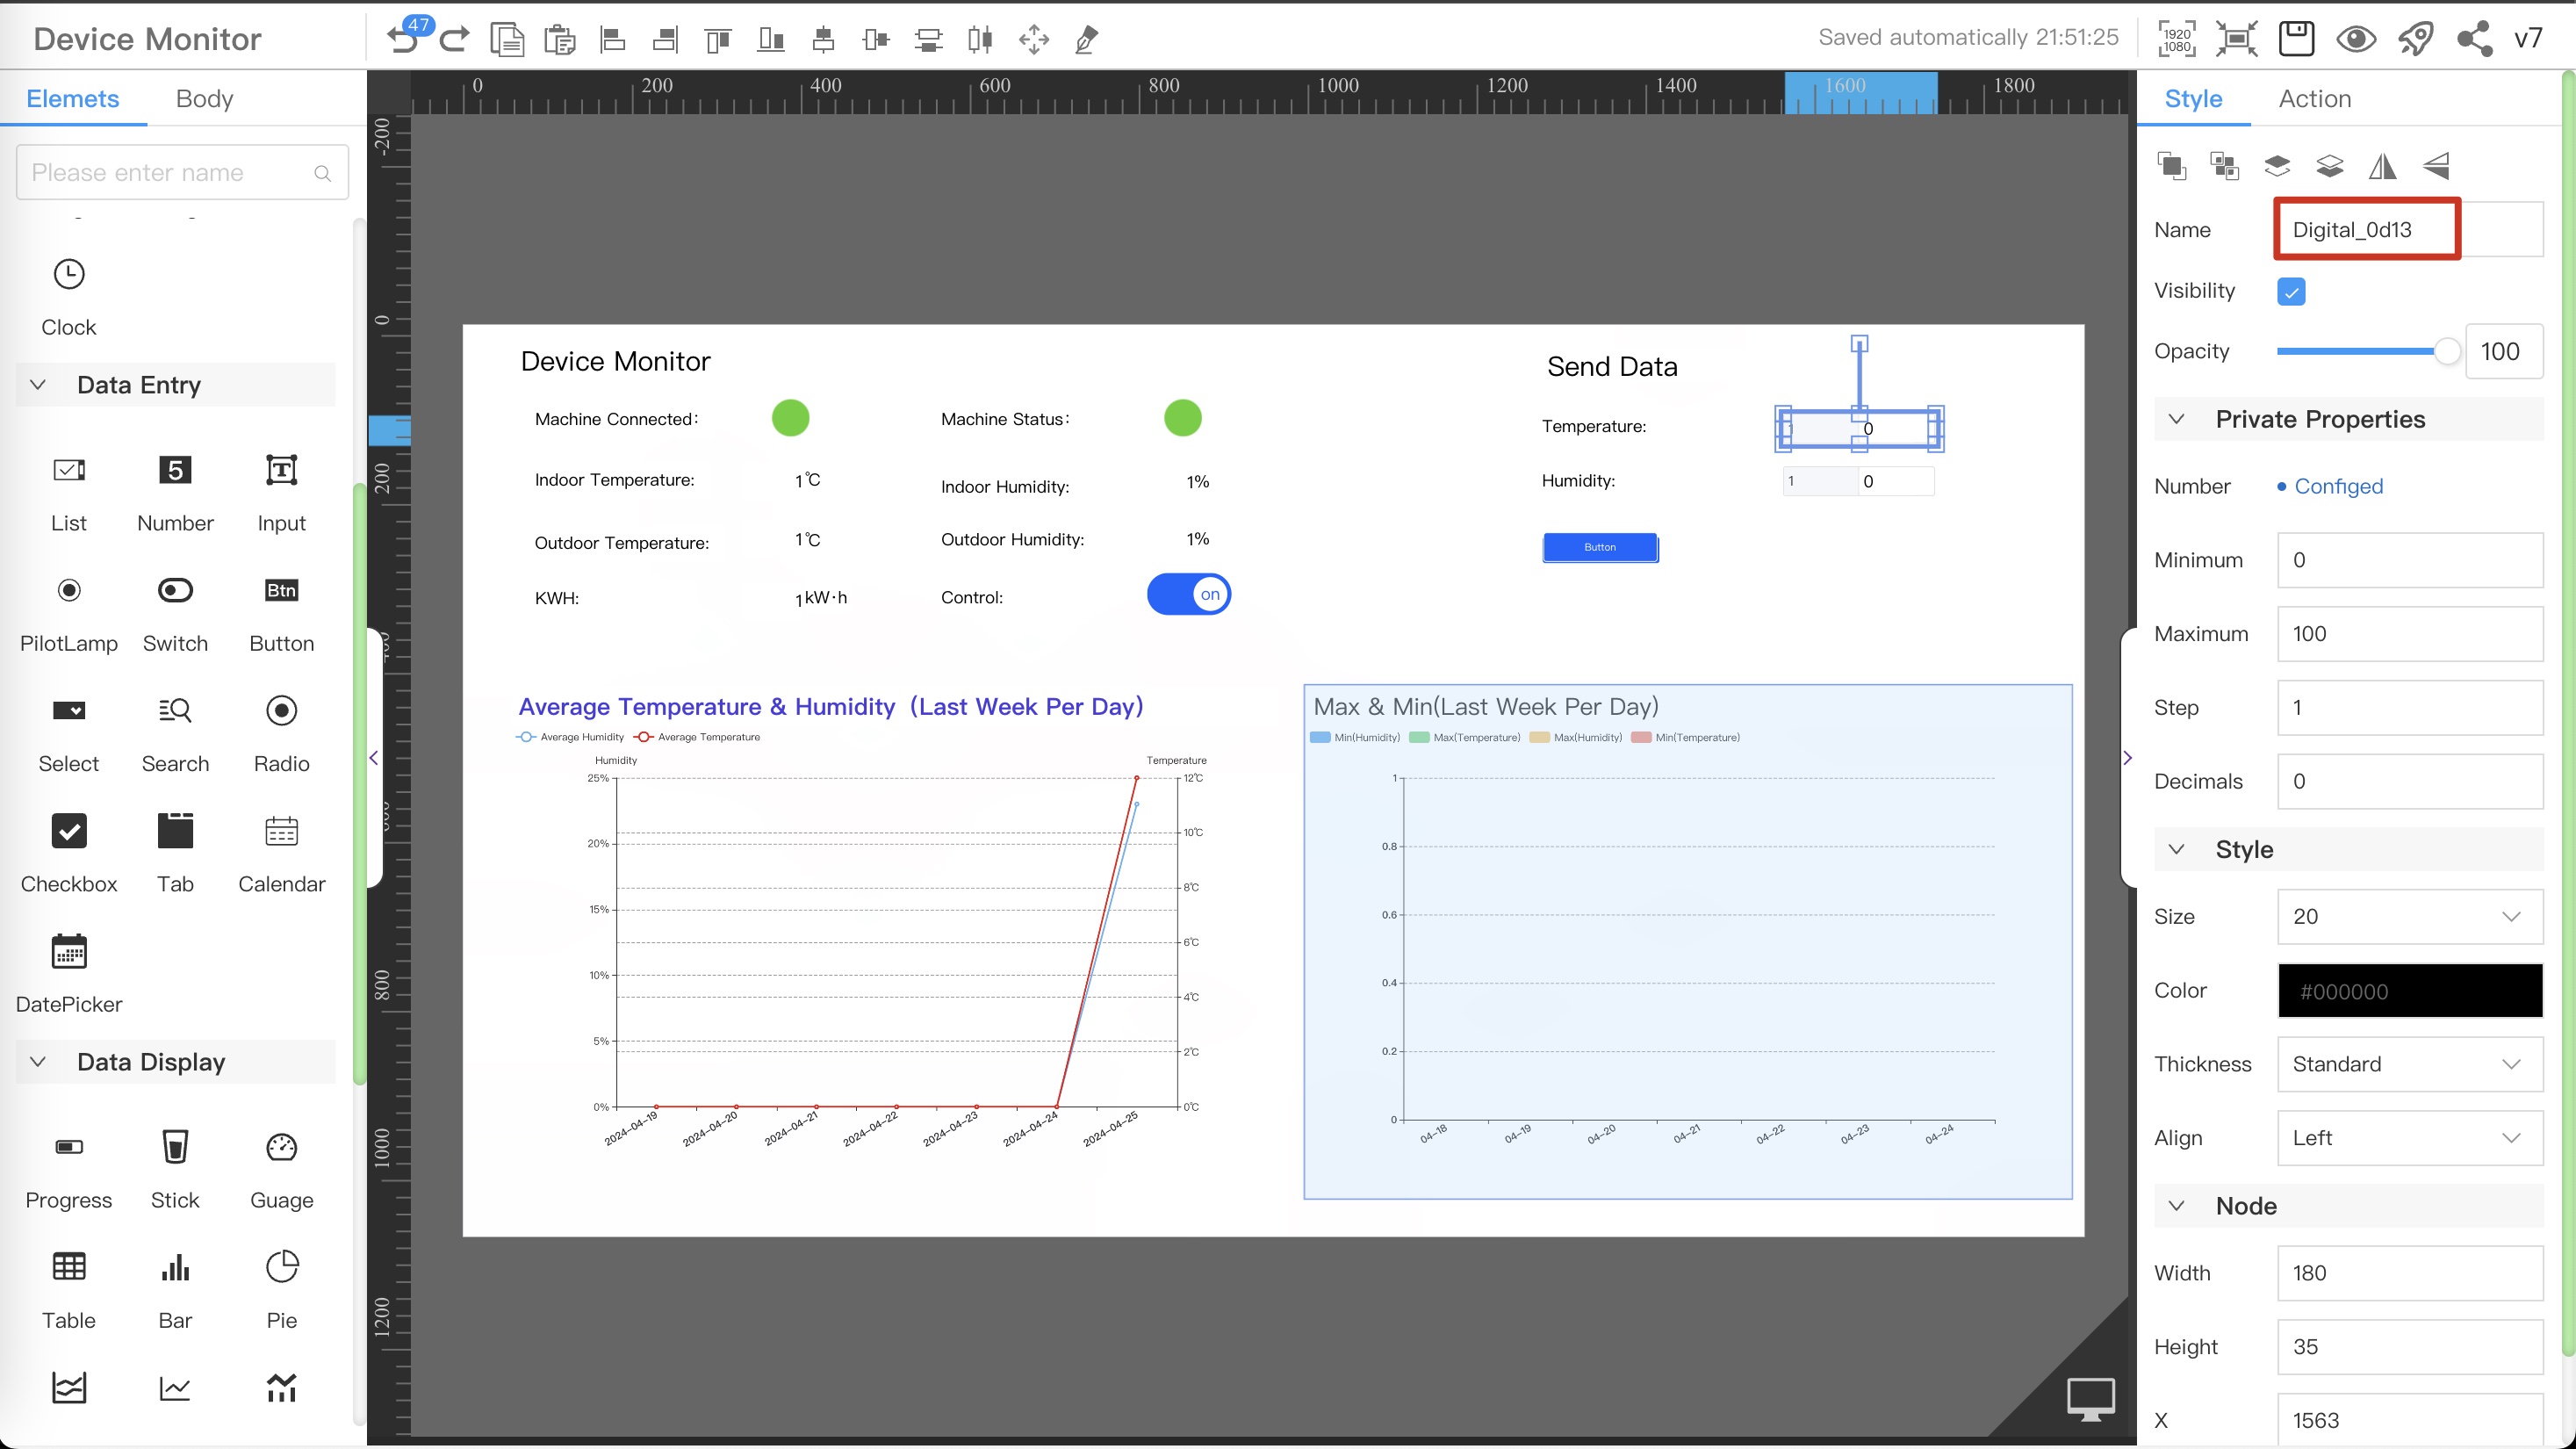
2.5 Select the dragged component and configure the
Private Propertiesparameters in theStyleon the right, refer to the serial number in the figure below-
Select
ts -
select
avg:indoor_rh -
Select
avg:indoor_t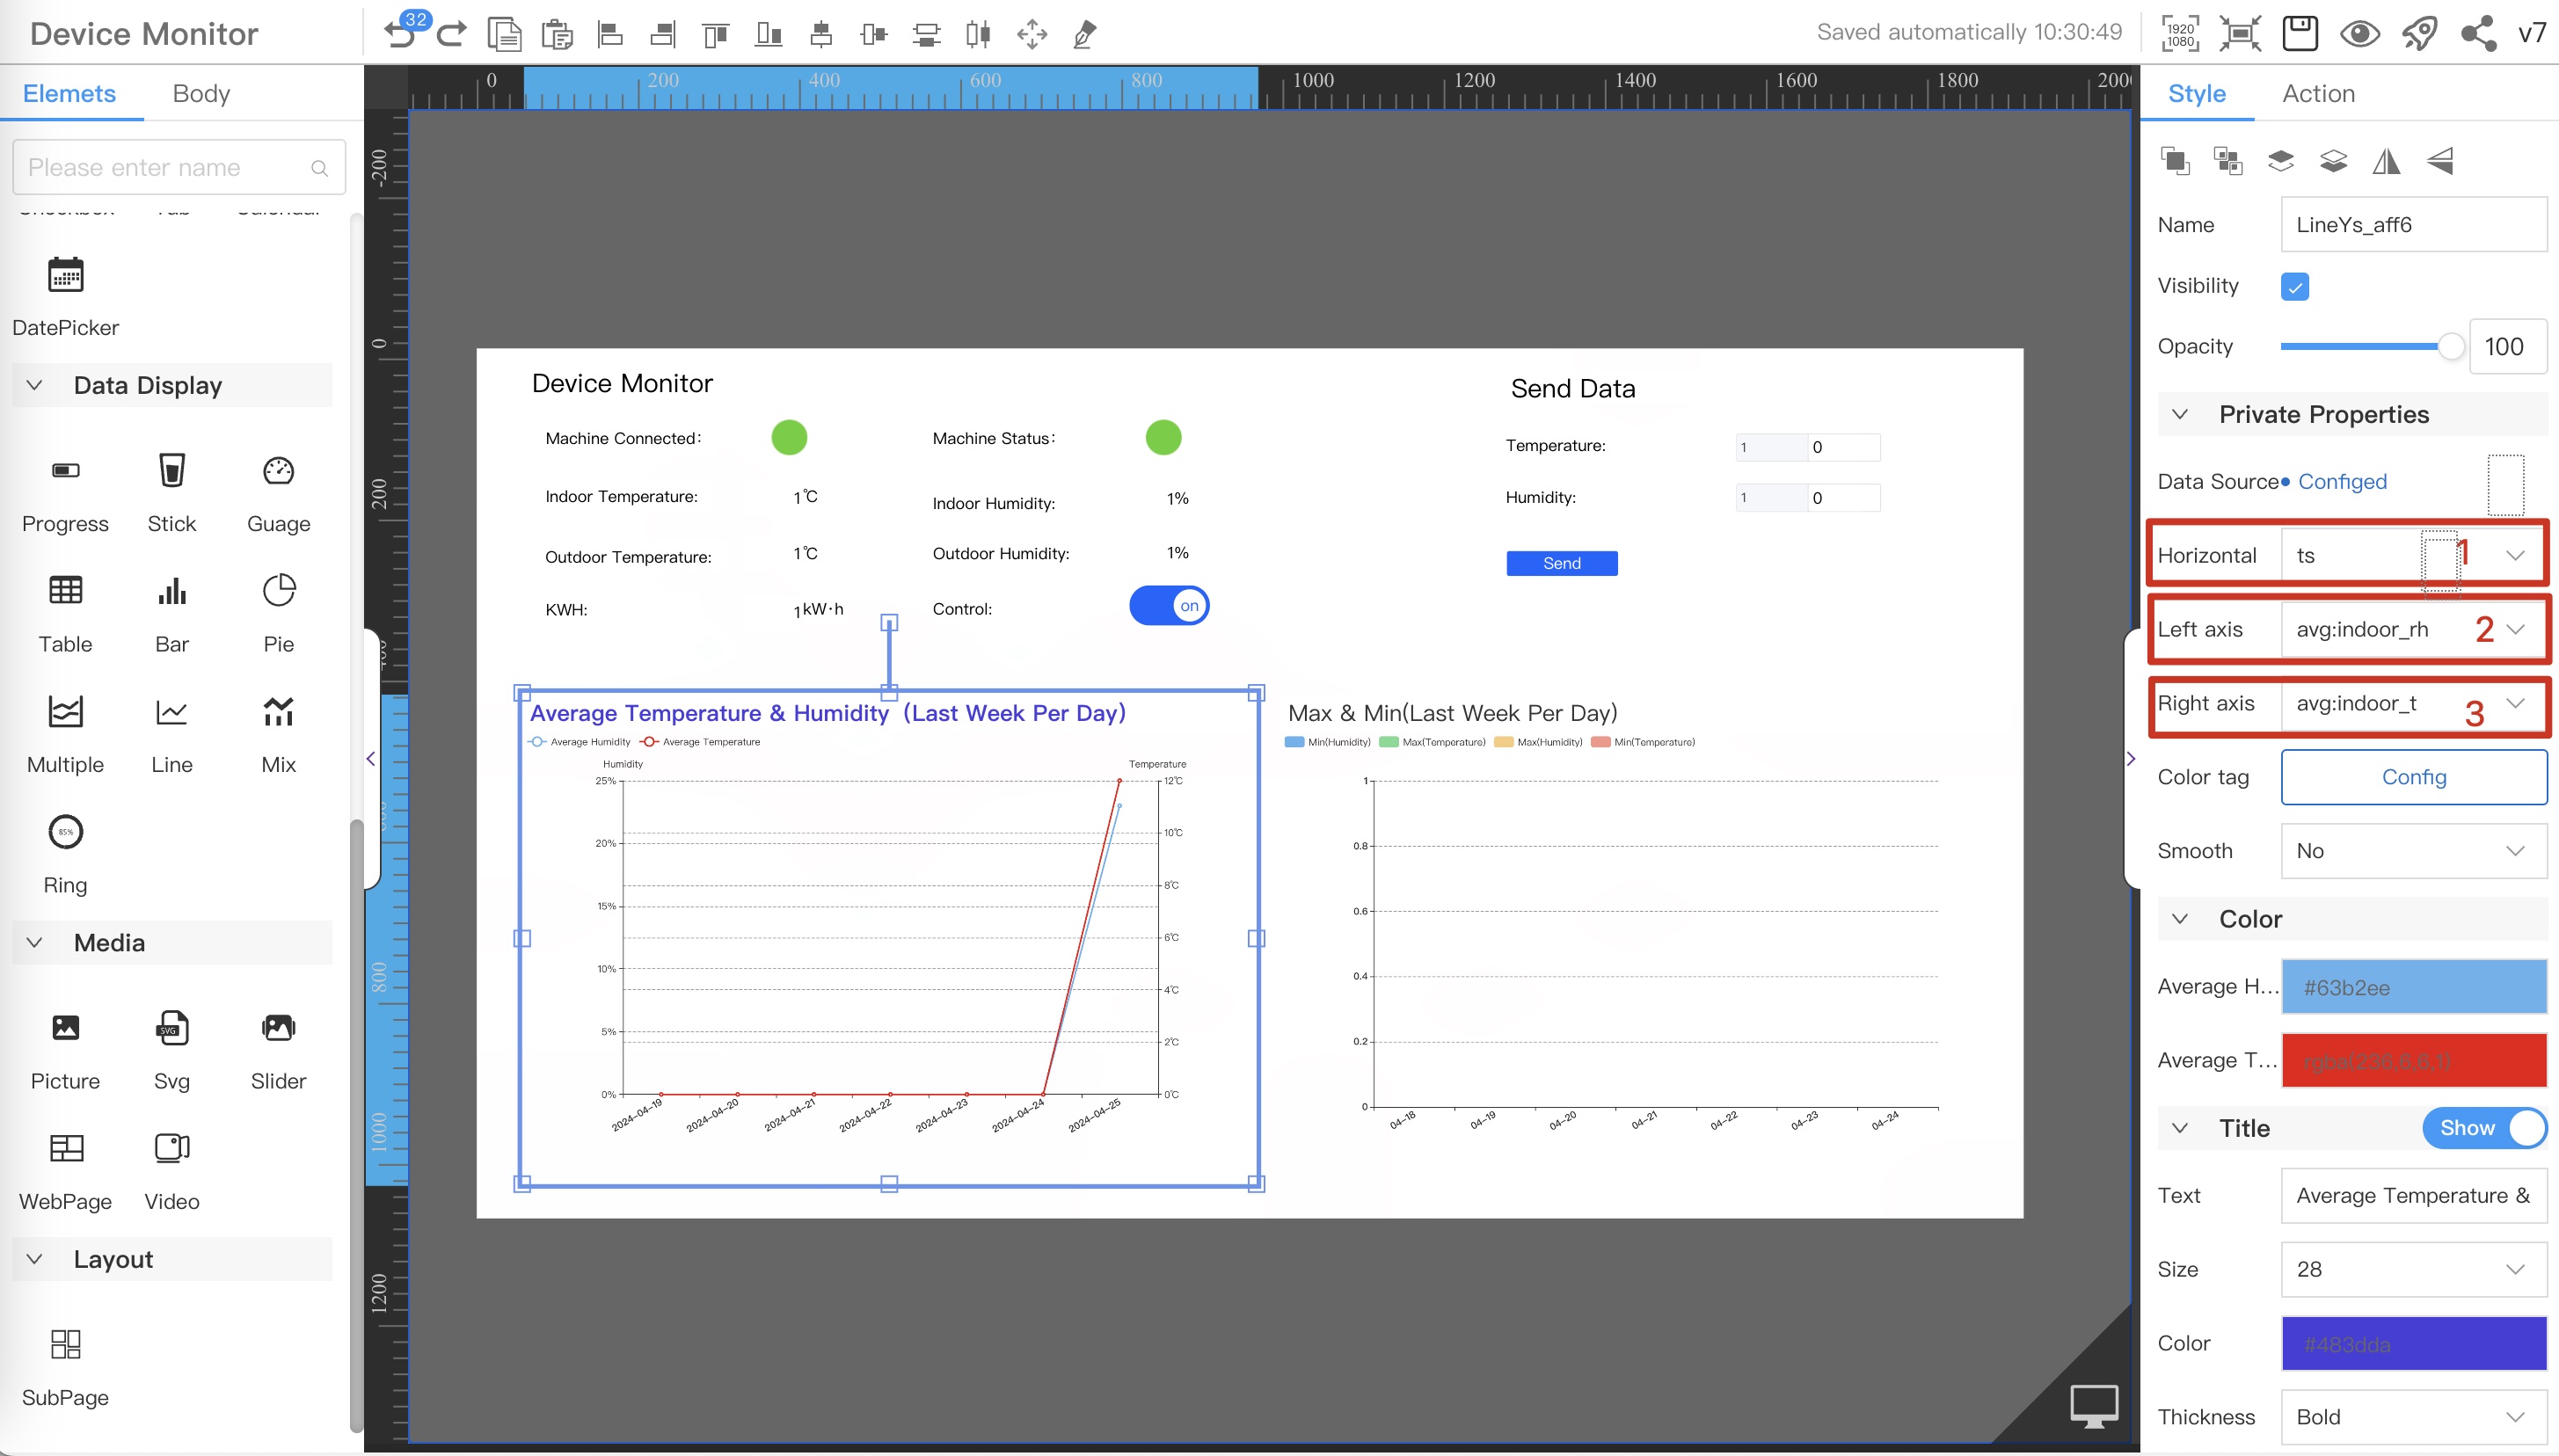
-
-
6. Display the highest and lowest temperature and humidity for the past 7 days
This feature requires custom data sources to be created and displayed using graphical components.
-
Add a data source
-
1.1. Switch to
Switch Mgmmode, clickDevelop->DataSourcein the left menu to open the data source page, switch to theDevice DataSourcedata source, and click theAddbutton to create a new data source.

-
Time dimension: Click the radio button after the time dimension to pop up the time dimension parameters
-
Time period: Statistics for the past 7 days
-
Collection cycle: once a day
-
Collection start and collection interval: Statistics on the highest and lowest temperature and humidity from 0:00 to 24:00 every day. Fill in according to the actual situation. For example, if the effective statistical time is from 8:00 am to 18:00 pm every day, fill in 8 and 10 respectively.
-
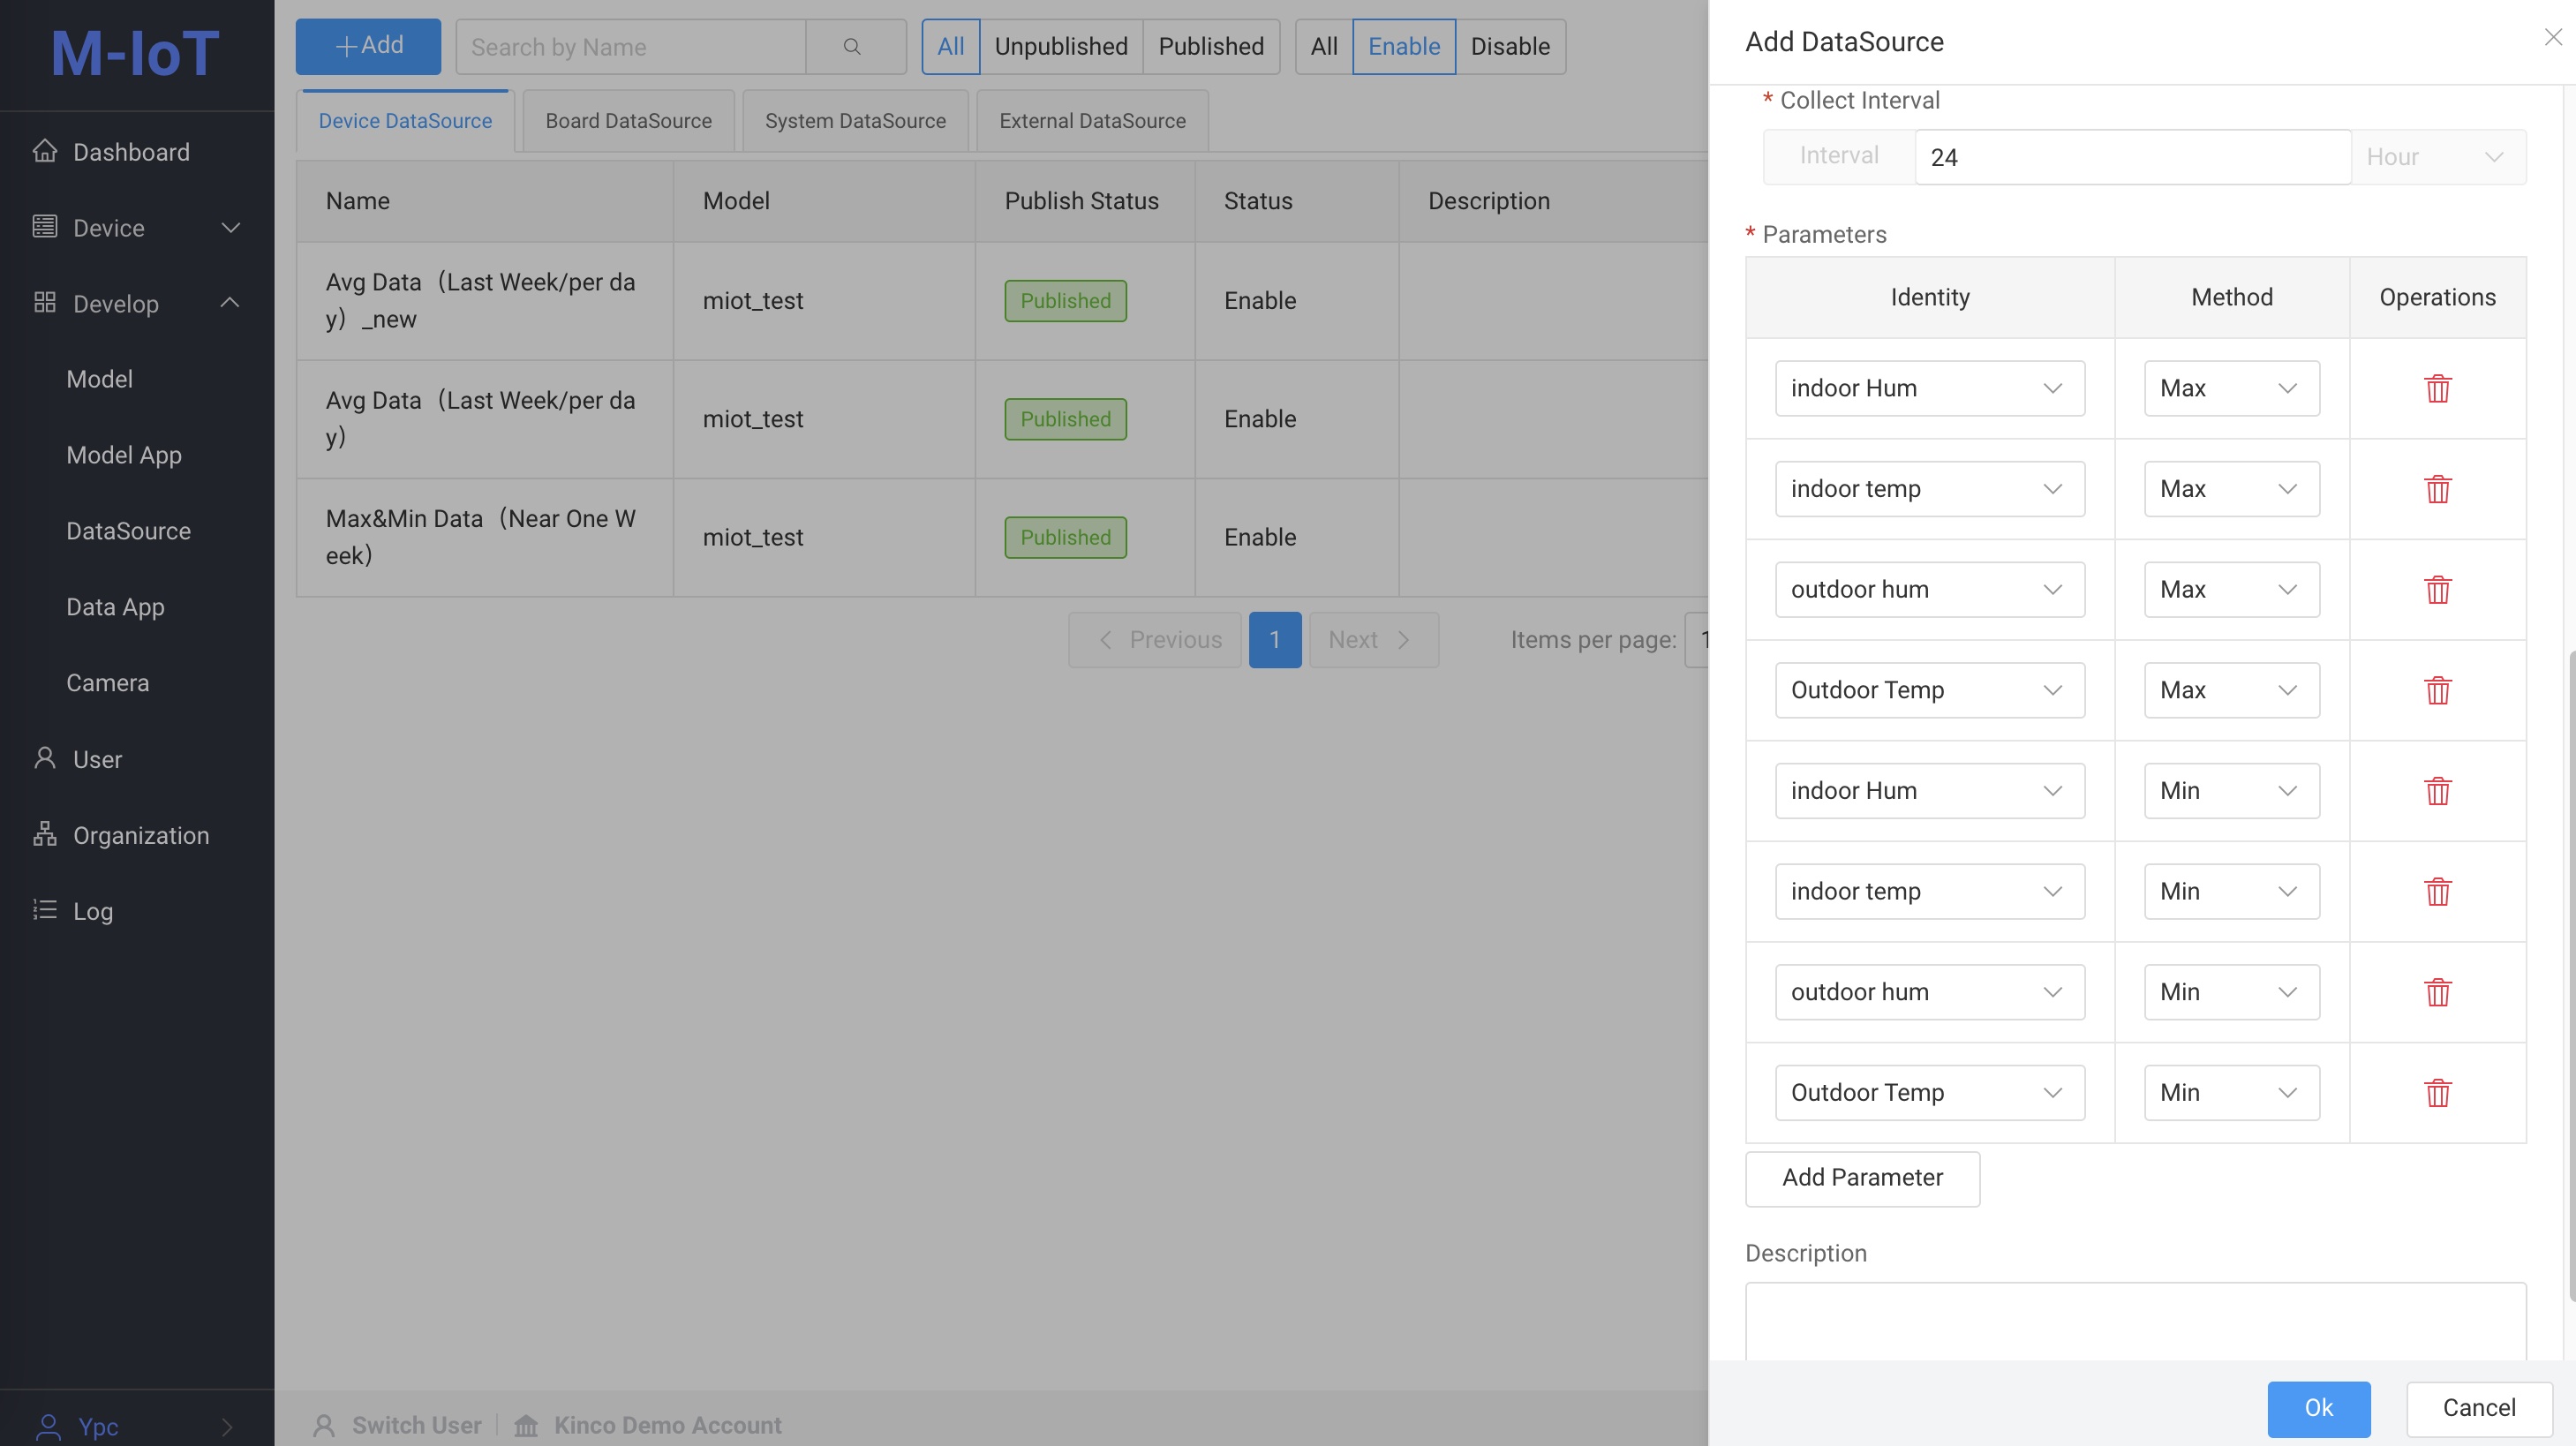
Parameters: Click the Add Parameter button to add eight parameters, namely:
- Identity is
indoor Hum, Method isMax. - Identity is
indoor temp, Method isMax. - Identity is
outdoor hum, Method isMax. - Identity is
Outdoor Temp, Method isMax. - Identity is
indoor Hum, Method isMin. - Identity is
indoor temp, Method isMin. - Identity is
outdoor hum, Method isMin. - Identity is
Outdoor Temp, Method isMin.
After filling in the information, click the
Okbutton to save the data source. - Identity is
-
-
1.2 Select
Output TypeasObject Arrayand clickOK.⚠️NoteAccording to the returned sample, select the appropriate component, please refer to output type data sample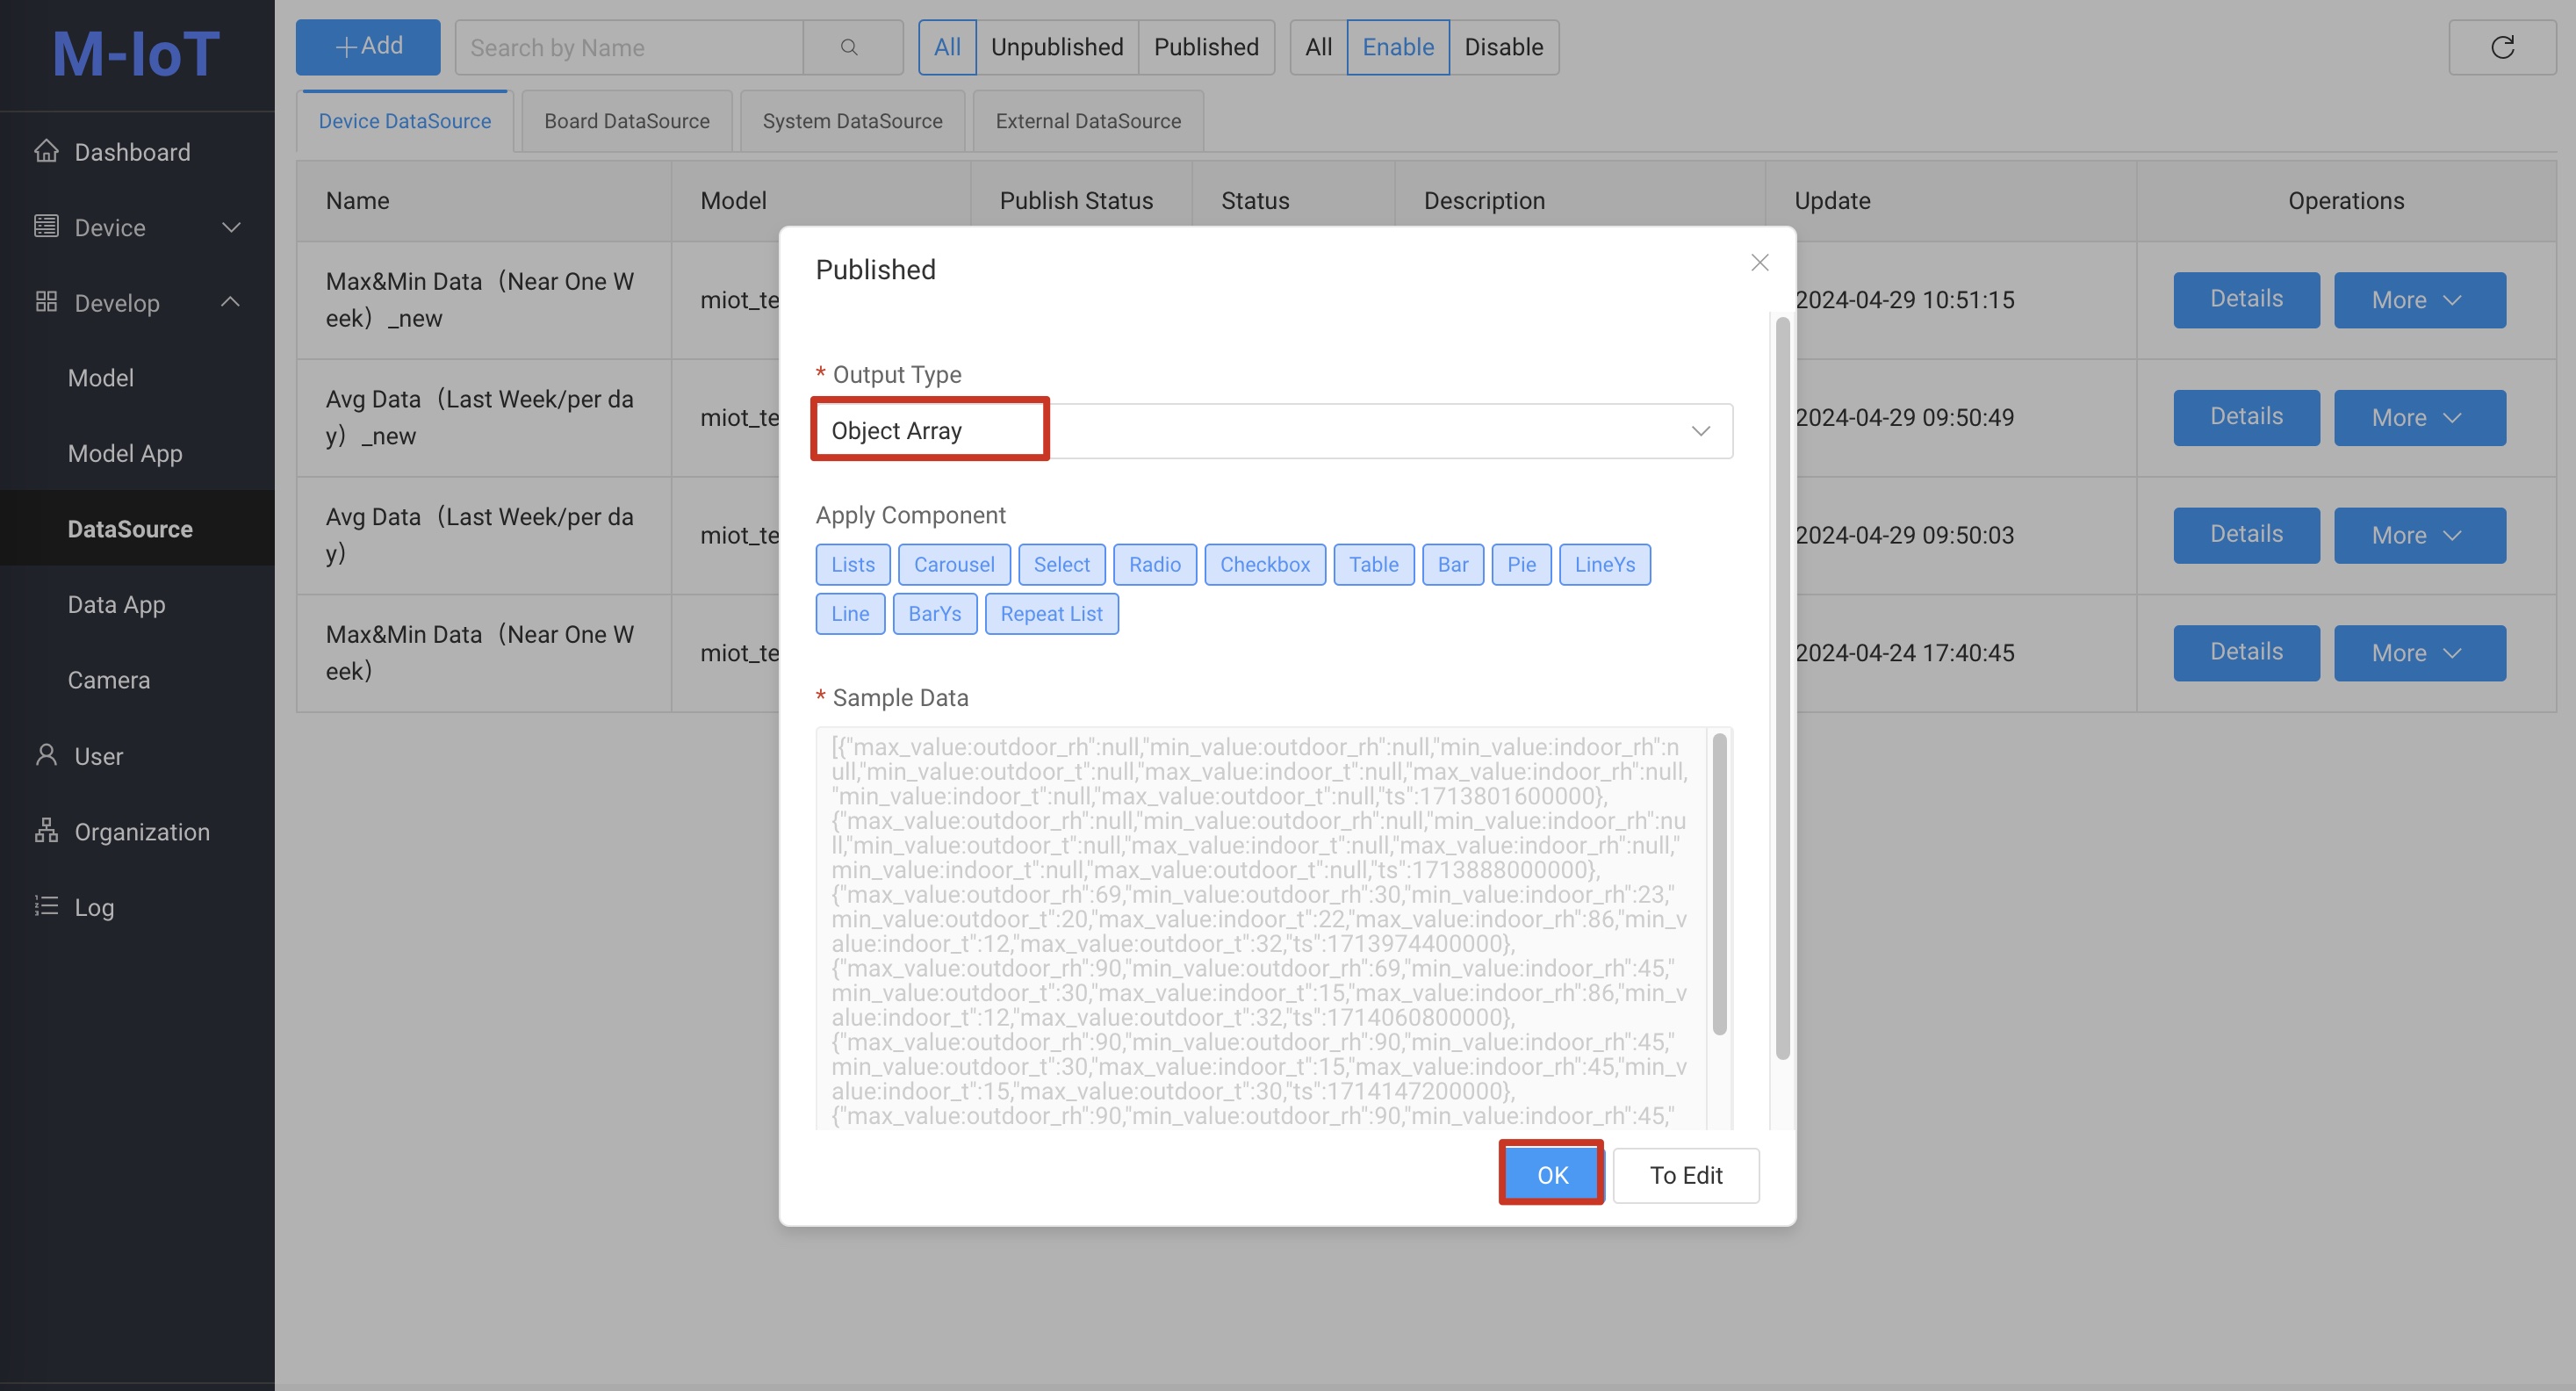
-
-
Visual page design
-
2.1 From the component library on the left, select the
Barcomponent and drag it into the canvas.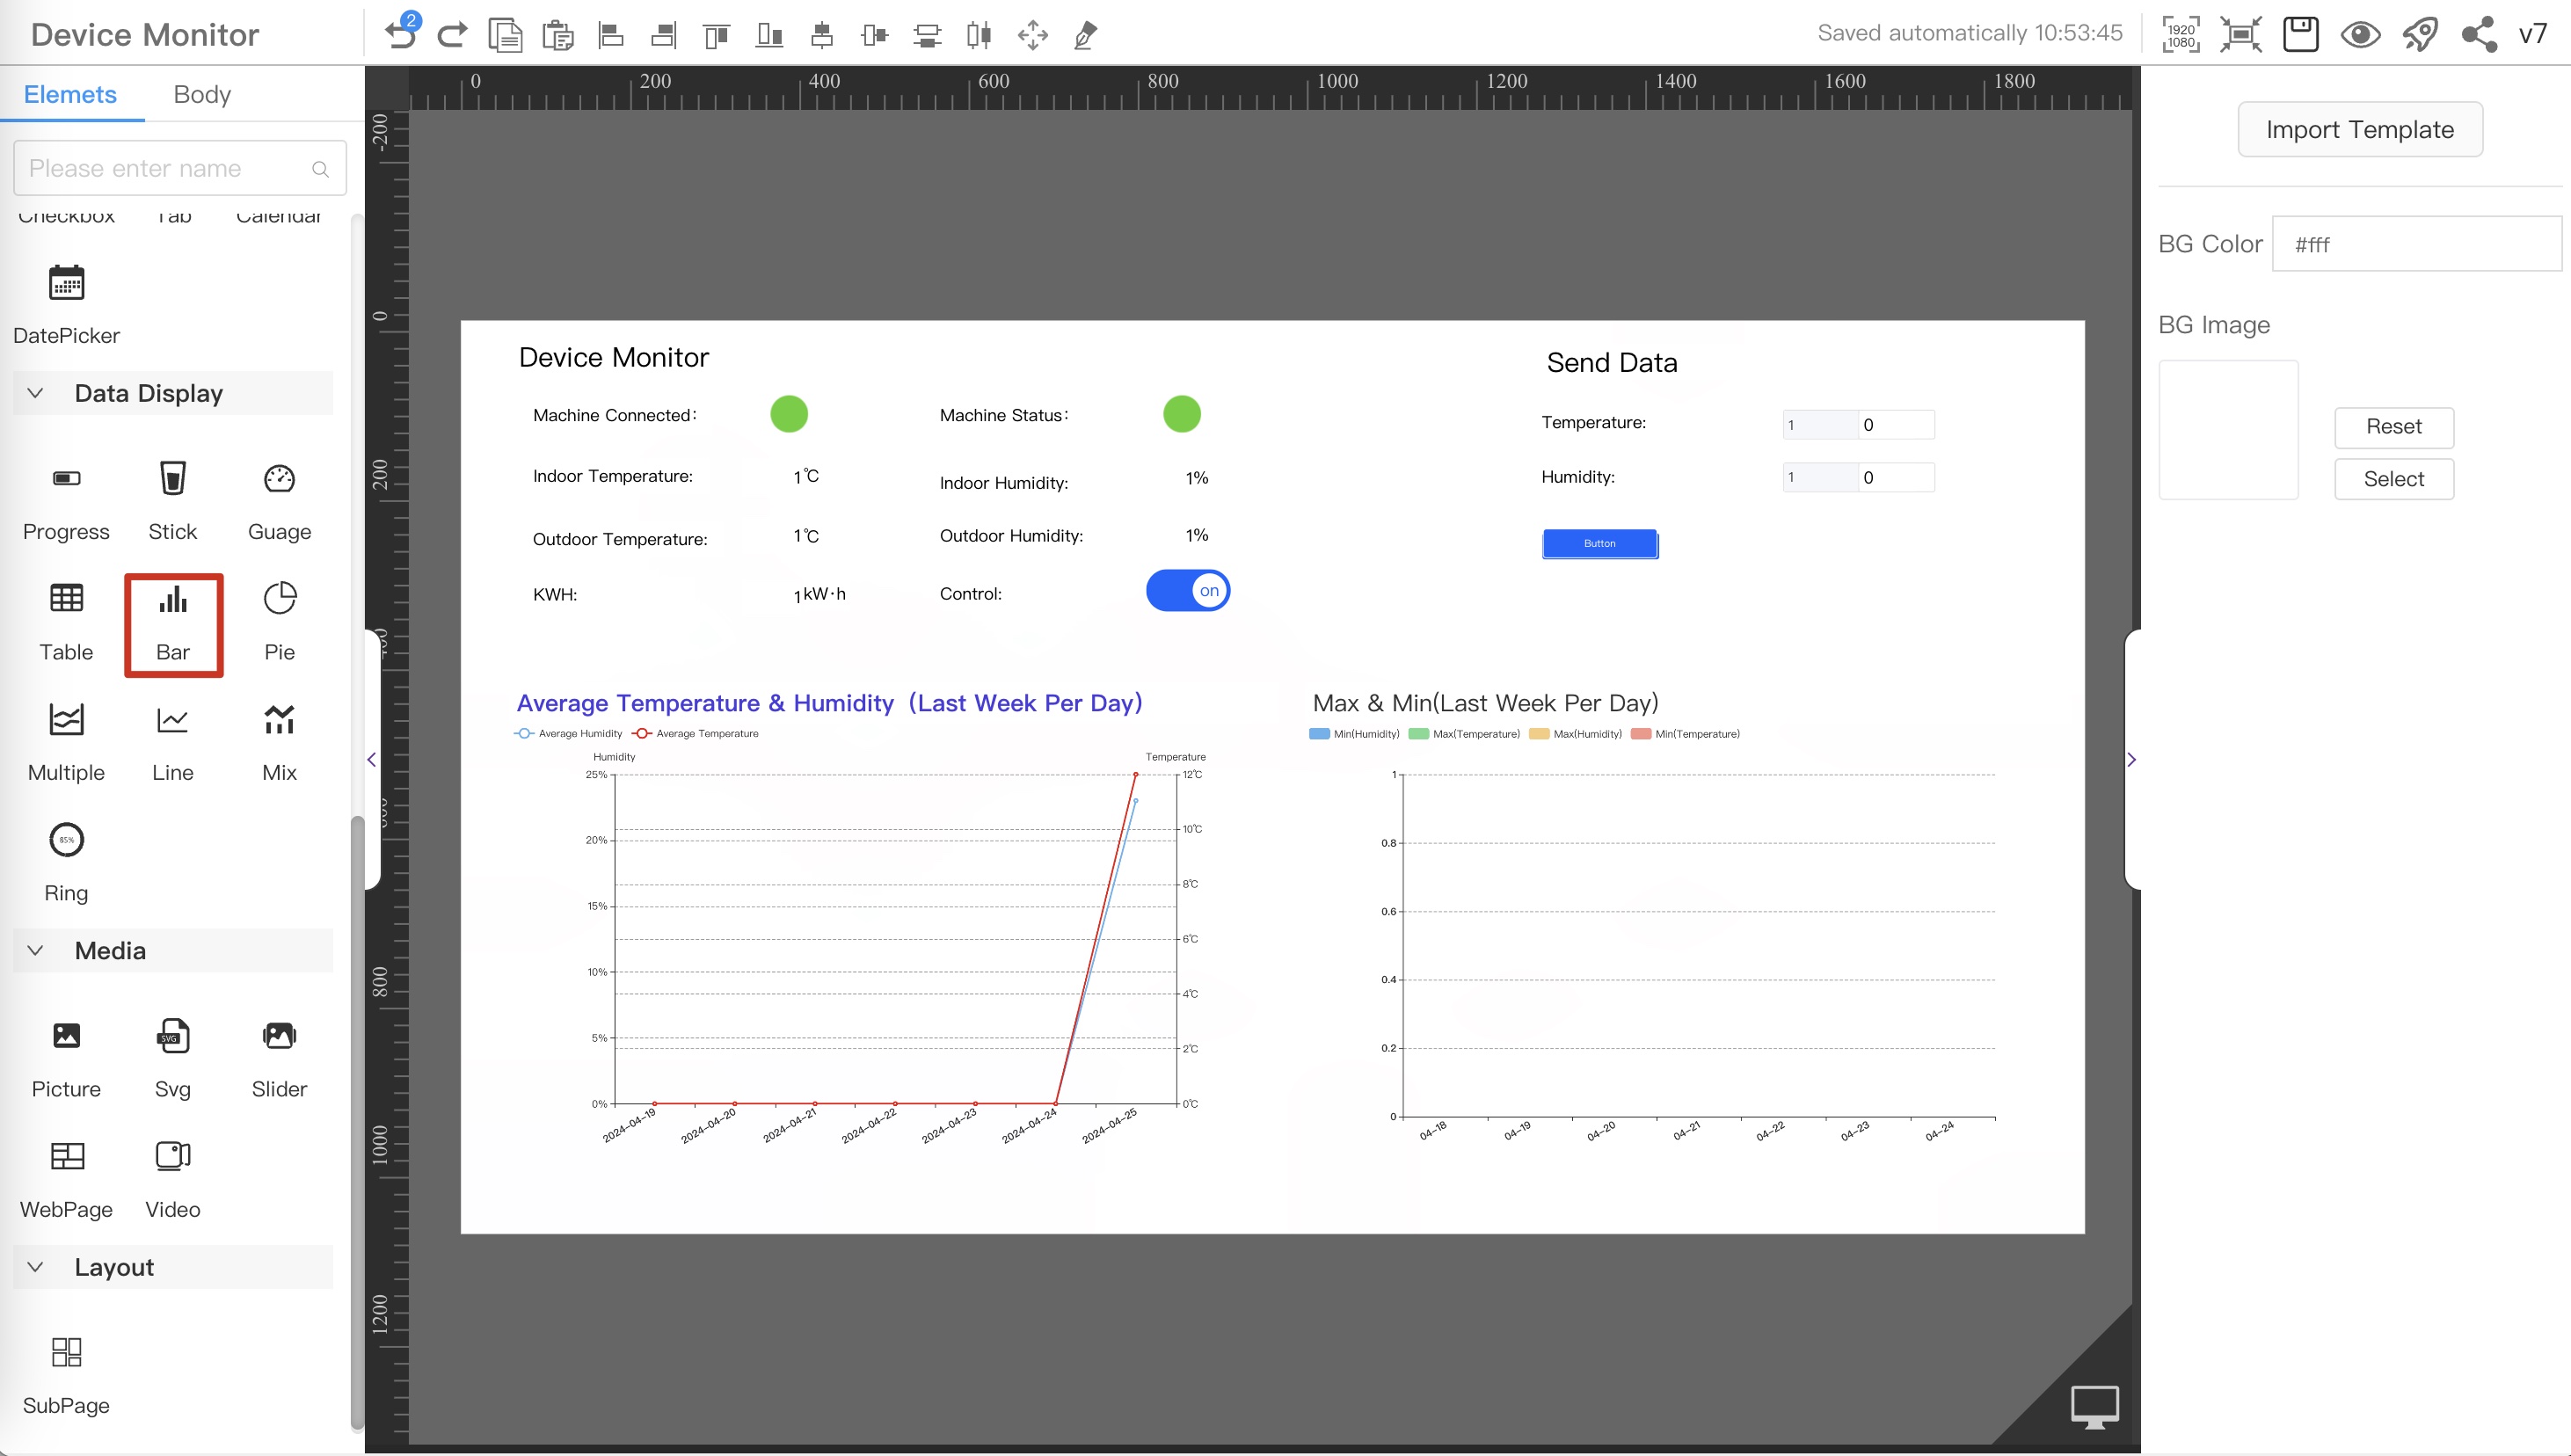
-
2.2 Select the dragged component, in the style
Data Sourceconfiguration item on the right, click theConfigbutton to configure the data source.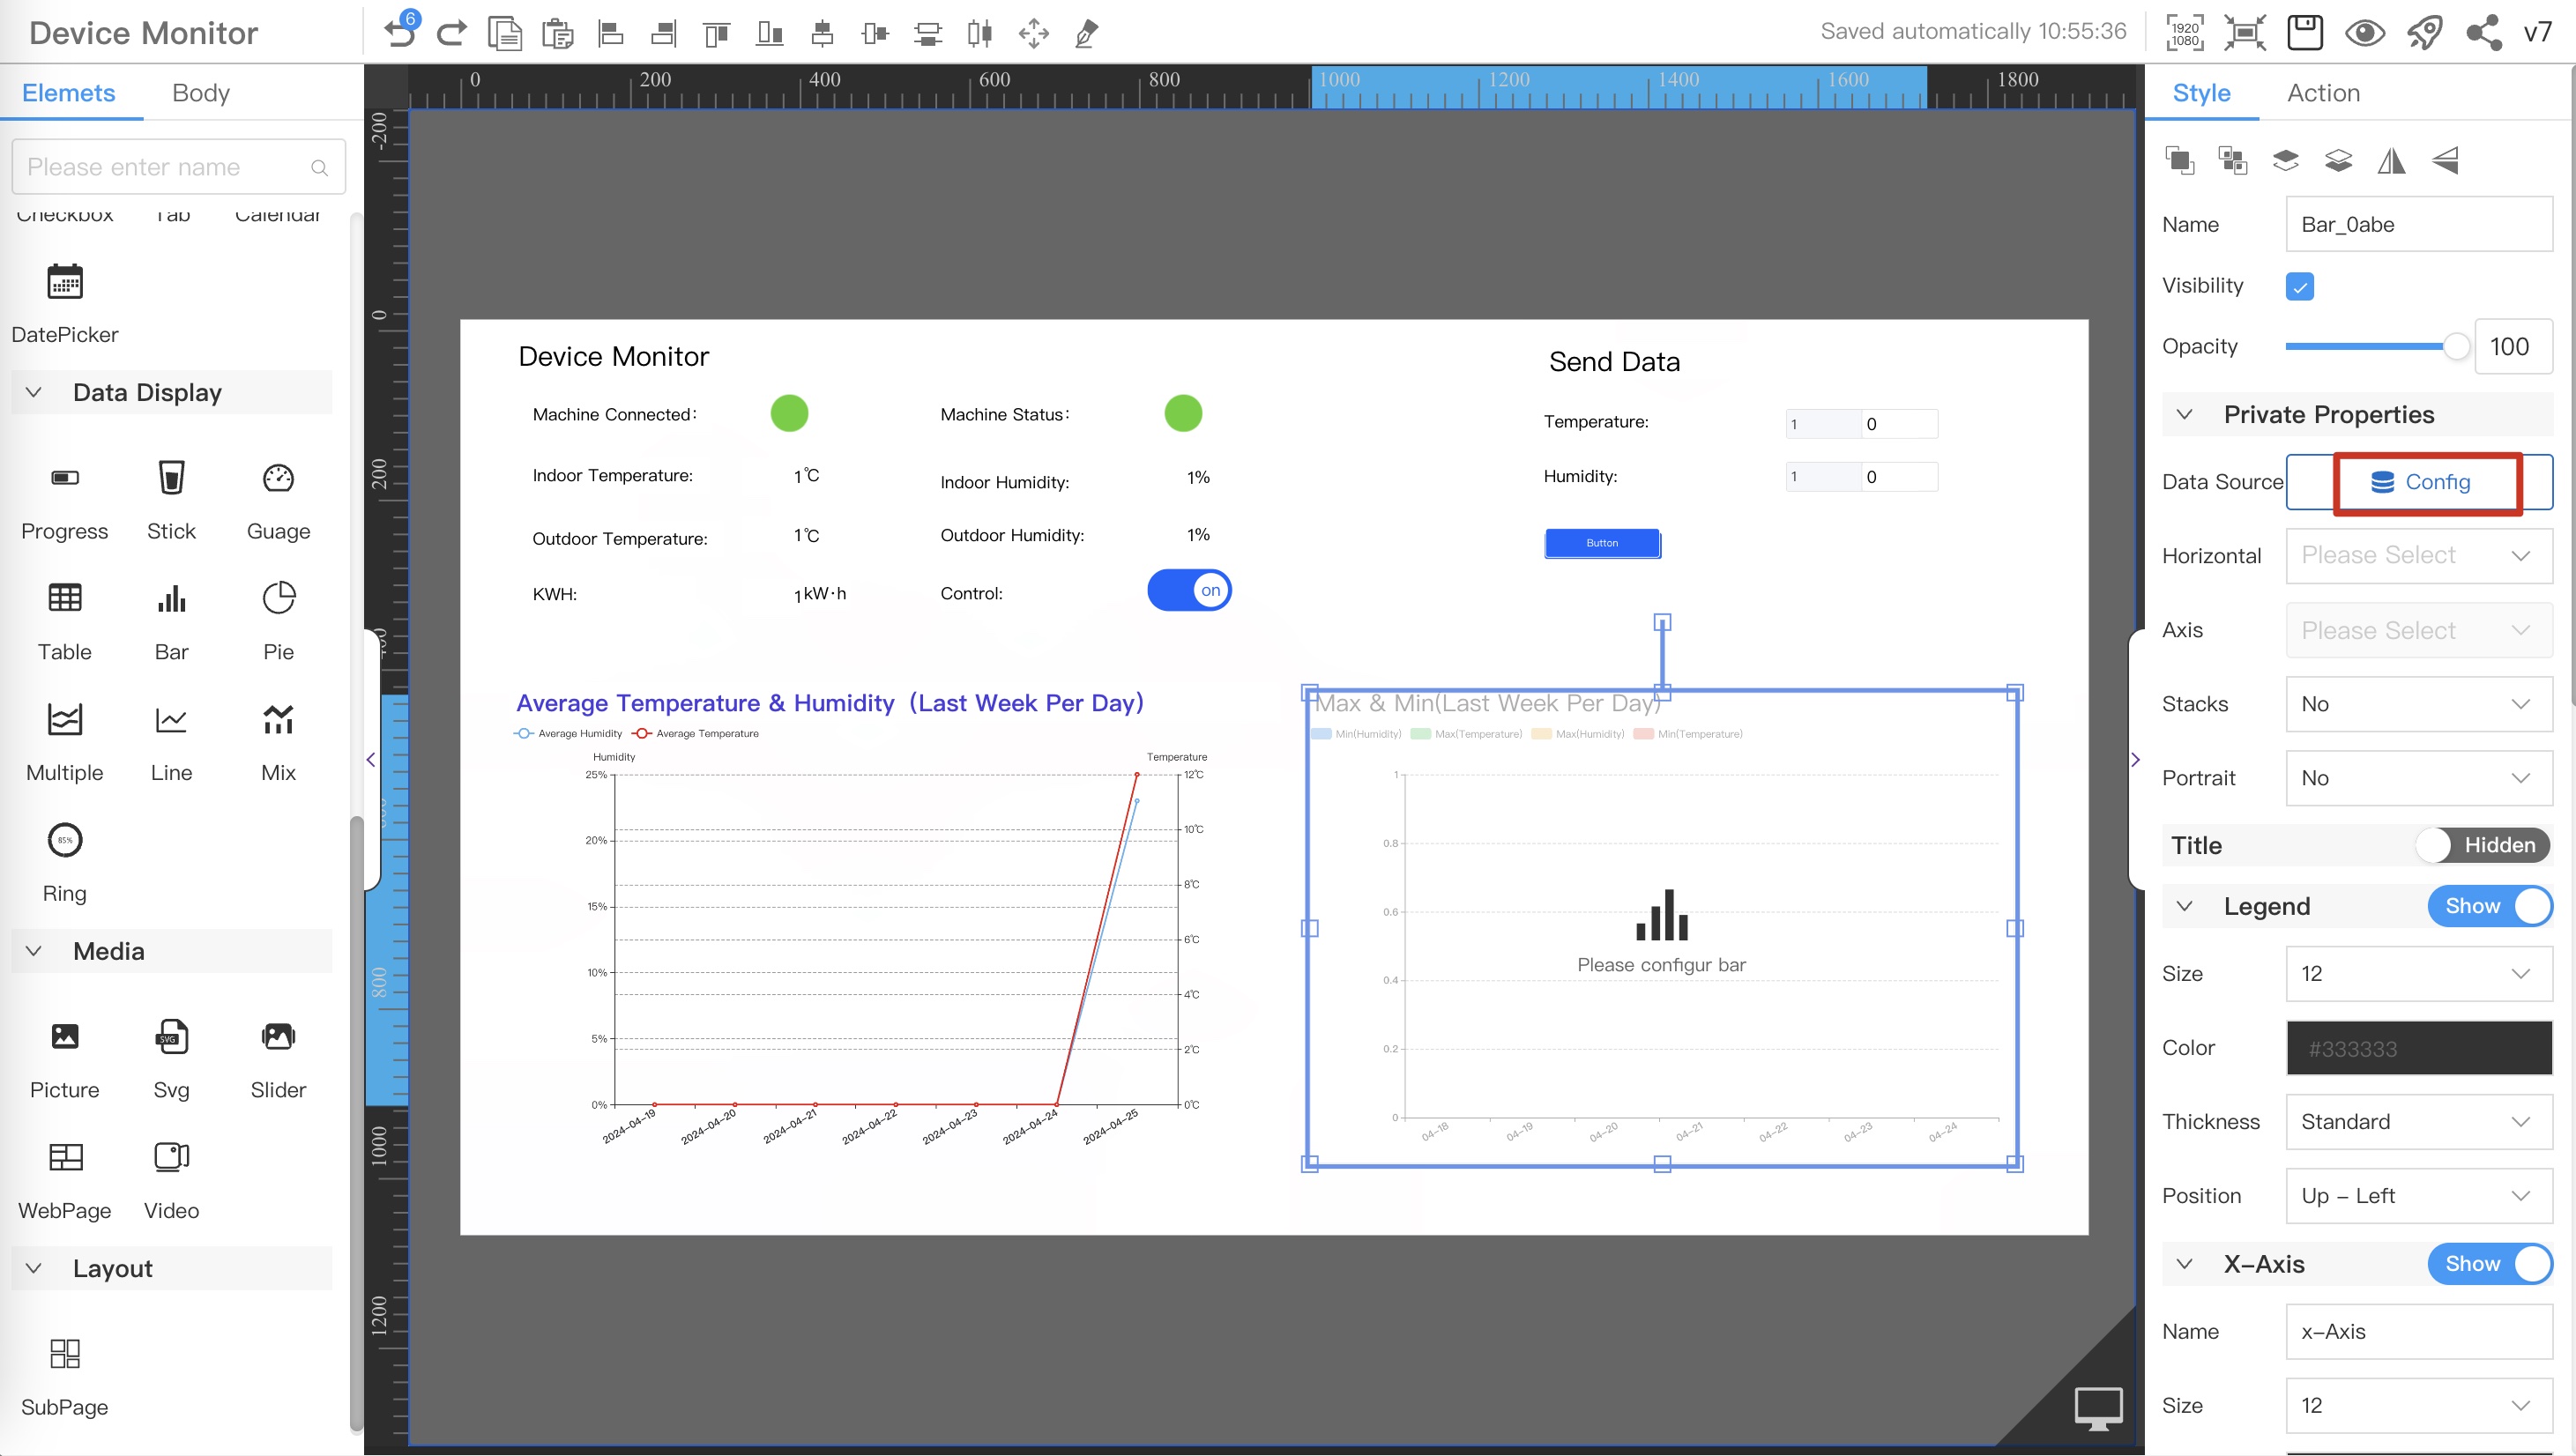
-
2.3 The data source config popup, configure the device parameters to be monitored, refer to the sequence number in the figure below
- Select the
Interfacedata source - Select the
Customtype data source - Select the
Max&Min Data (Near One Week)_newdata source
⚠️NoteSelect the data source you just created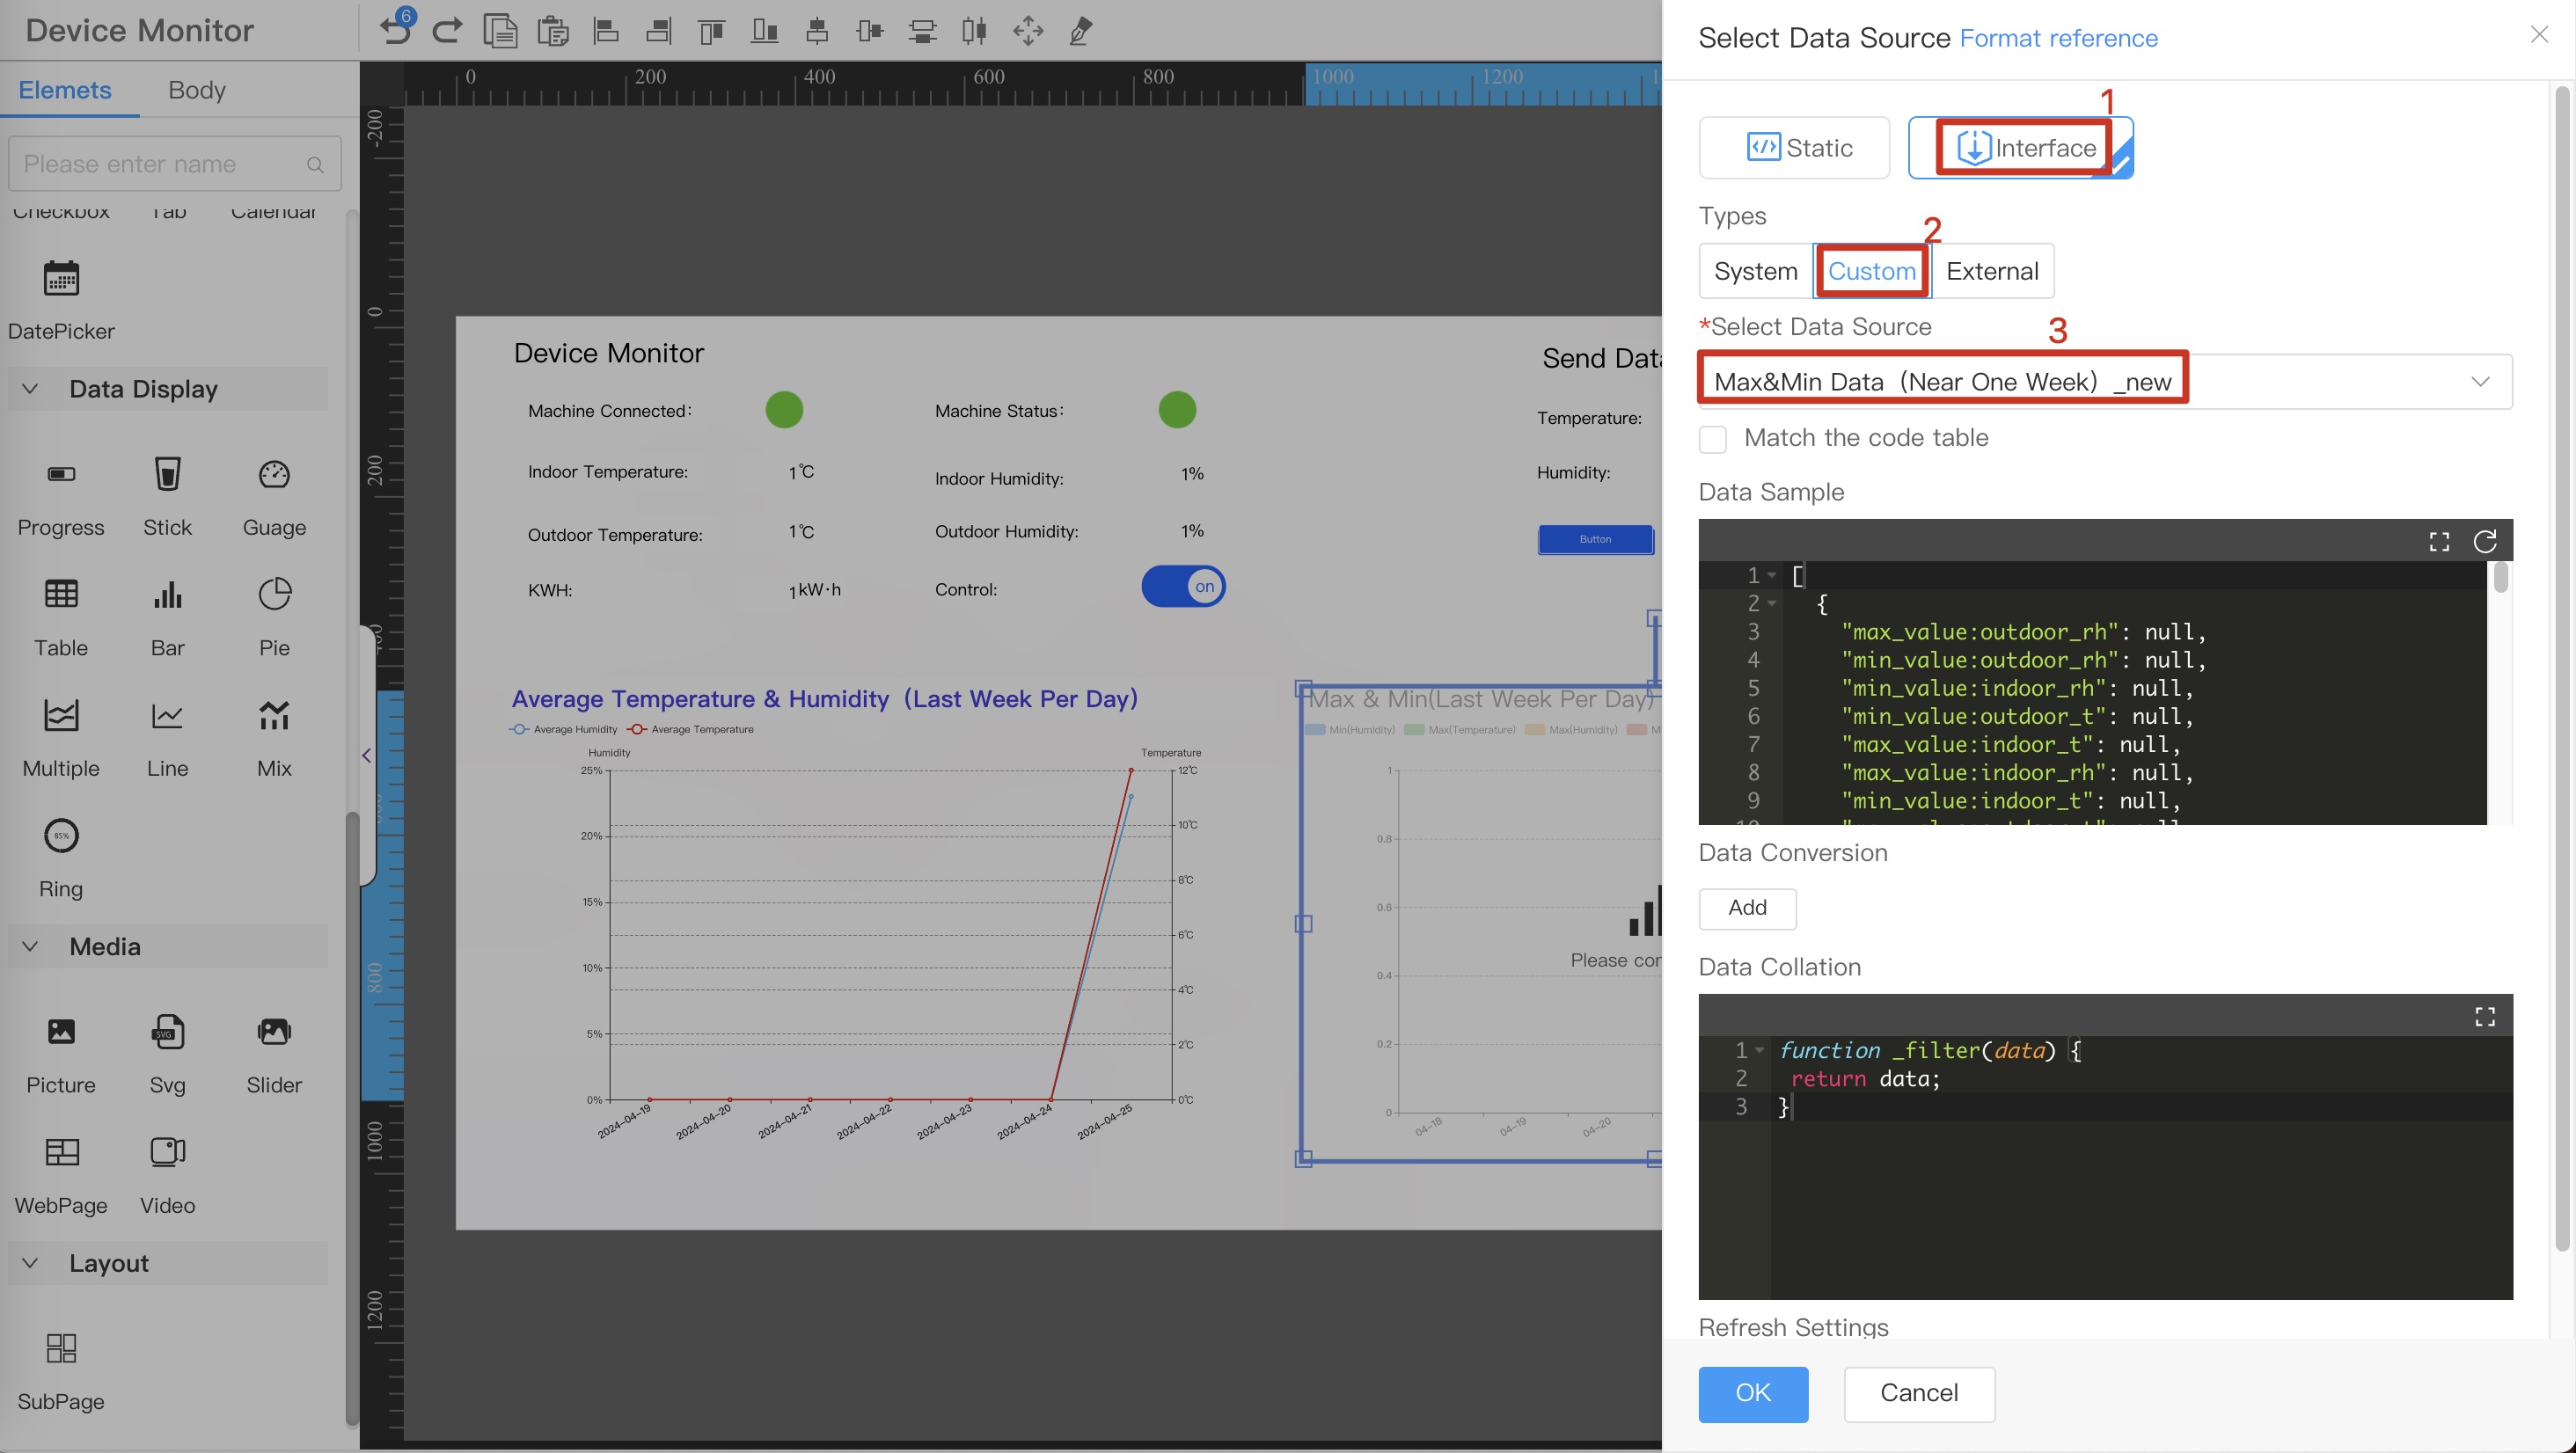
- Select the
-
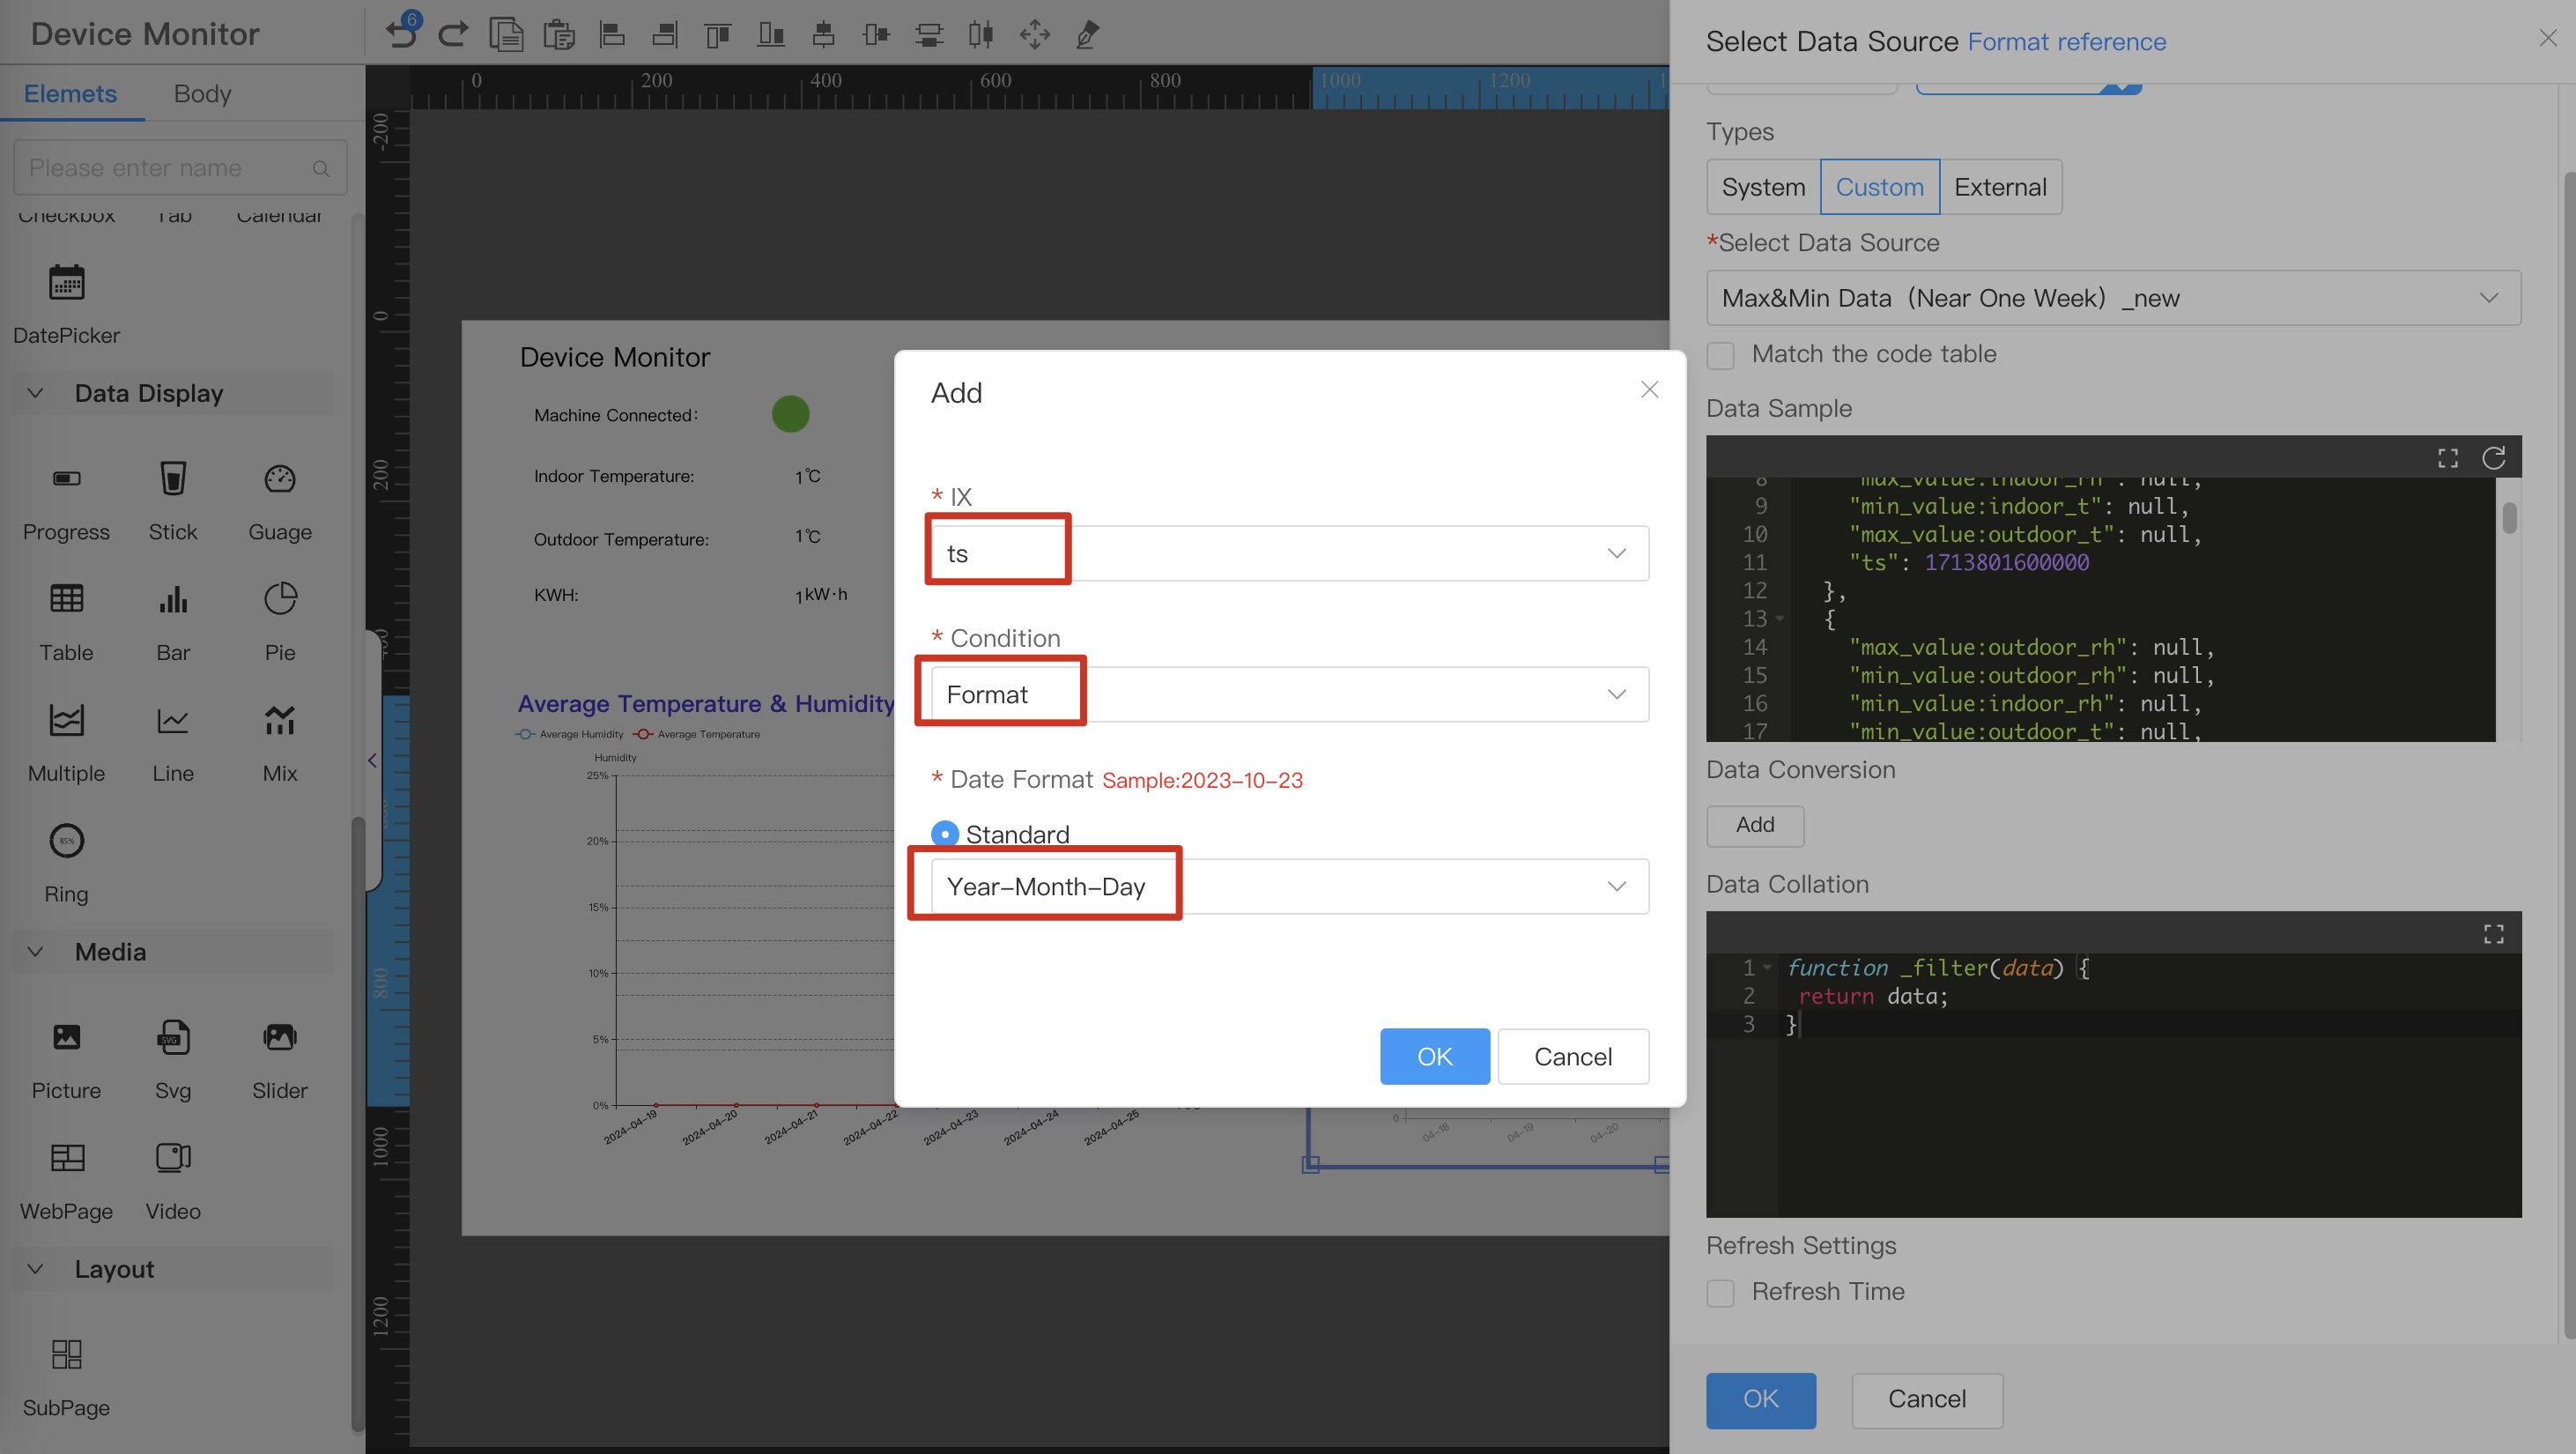
2.4 Format the data source time display format
-
Note
- Only fields named
tscan format Standardbased on specific needs
- Only fields named
-
Note
-
2.5 Select the dragged component and configure the
Private Propertiesparameters in theStyleon the right, refer to the serial number in the figure below-
Select
ts -
Select
min_value:indoor_rh,max_value:indoor_t,max_value:indoor_rh,max_value:indoor_rh
-
-
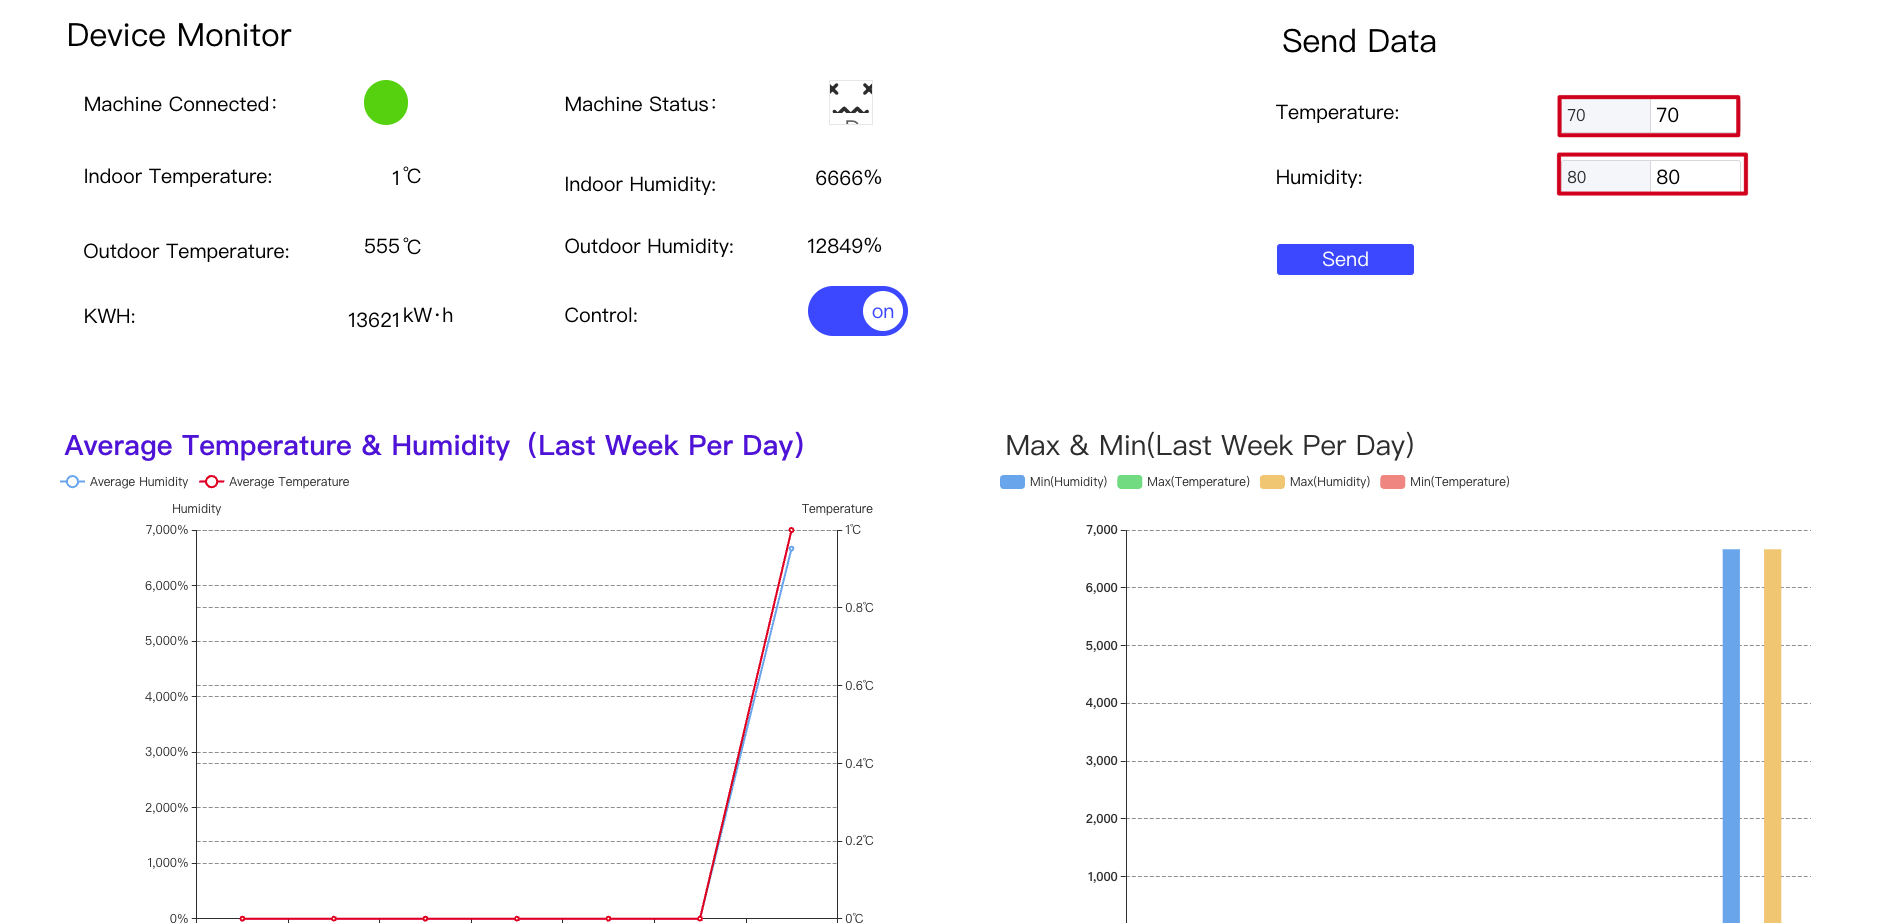
Final rendering effect

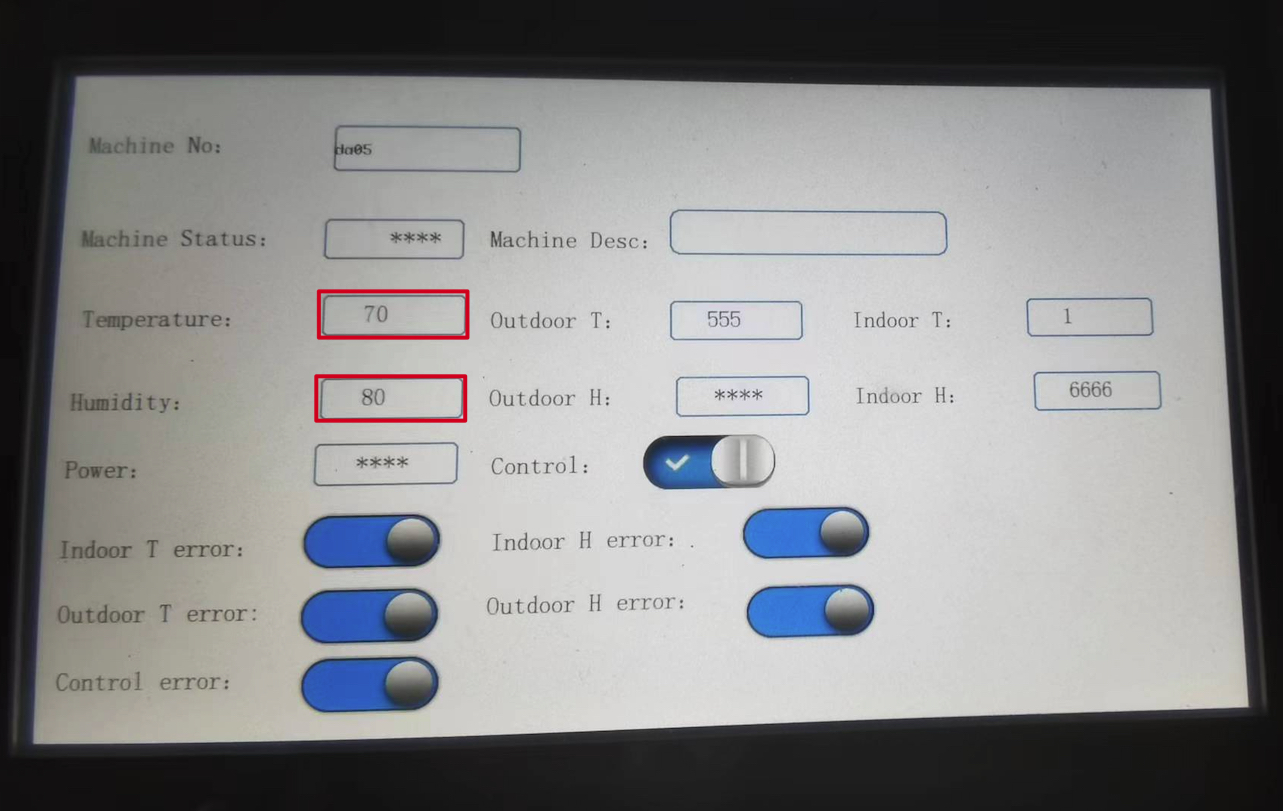
Issue device parameter Demo
Status display before issues
WEB

HMI

Status display after issued
WEB
HMI
View component name
Select the component and view the Name property in the Style Tab on the right
View send ix
The ix that can be sent must fit three conditions:
- IX is for
Environment Parameters - IX
Display Typeisnumber - IX
R/WisR/W
View ix
- Enter the
Modelmenu and clickConfig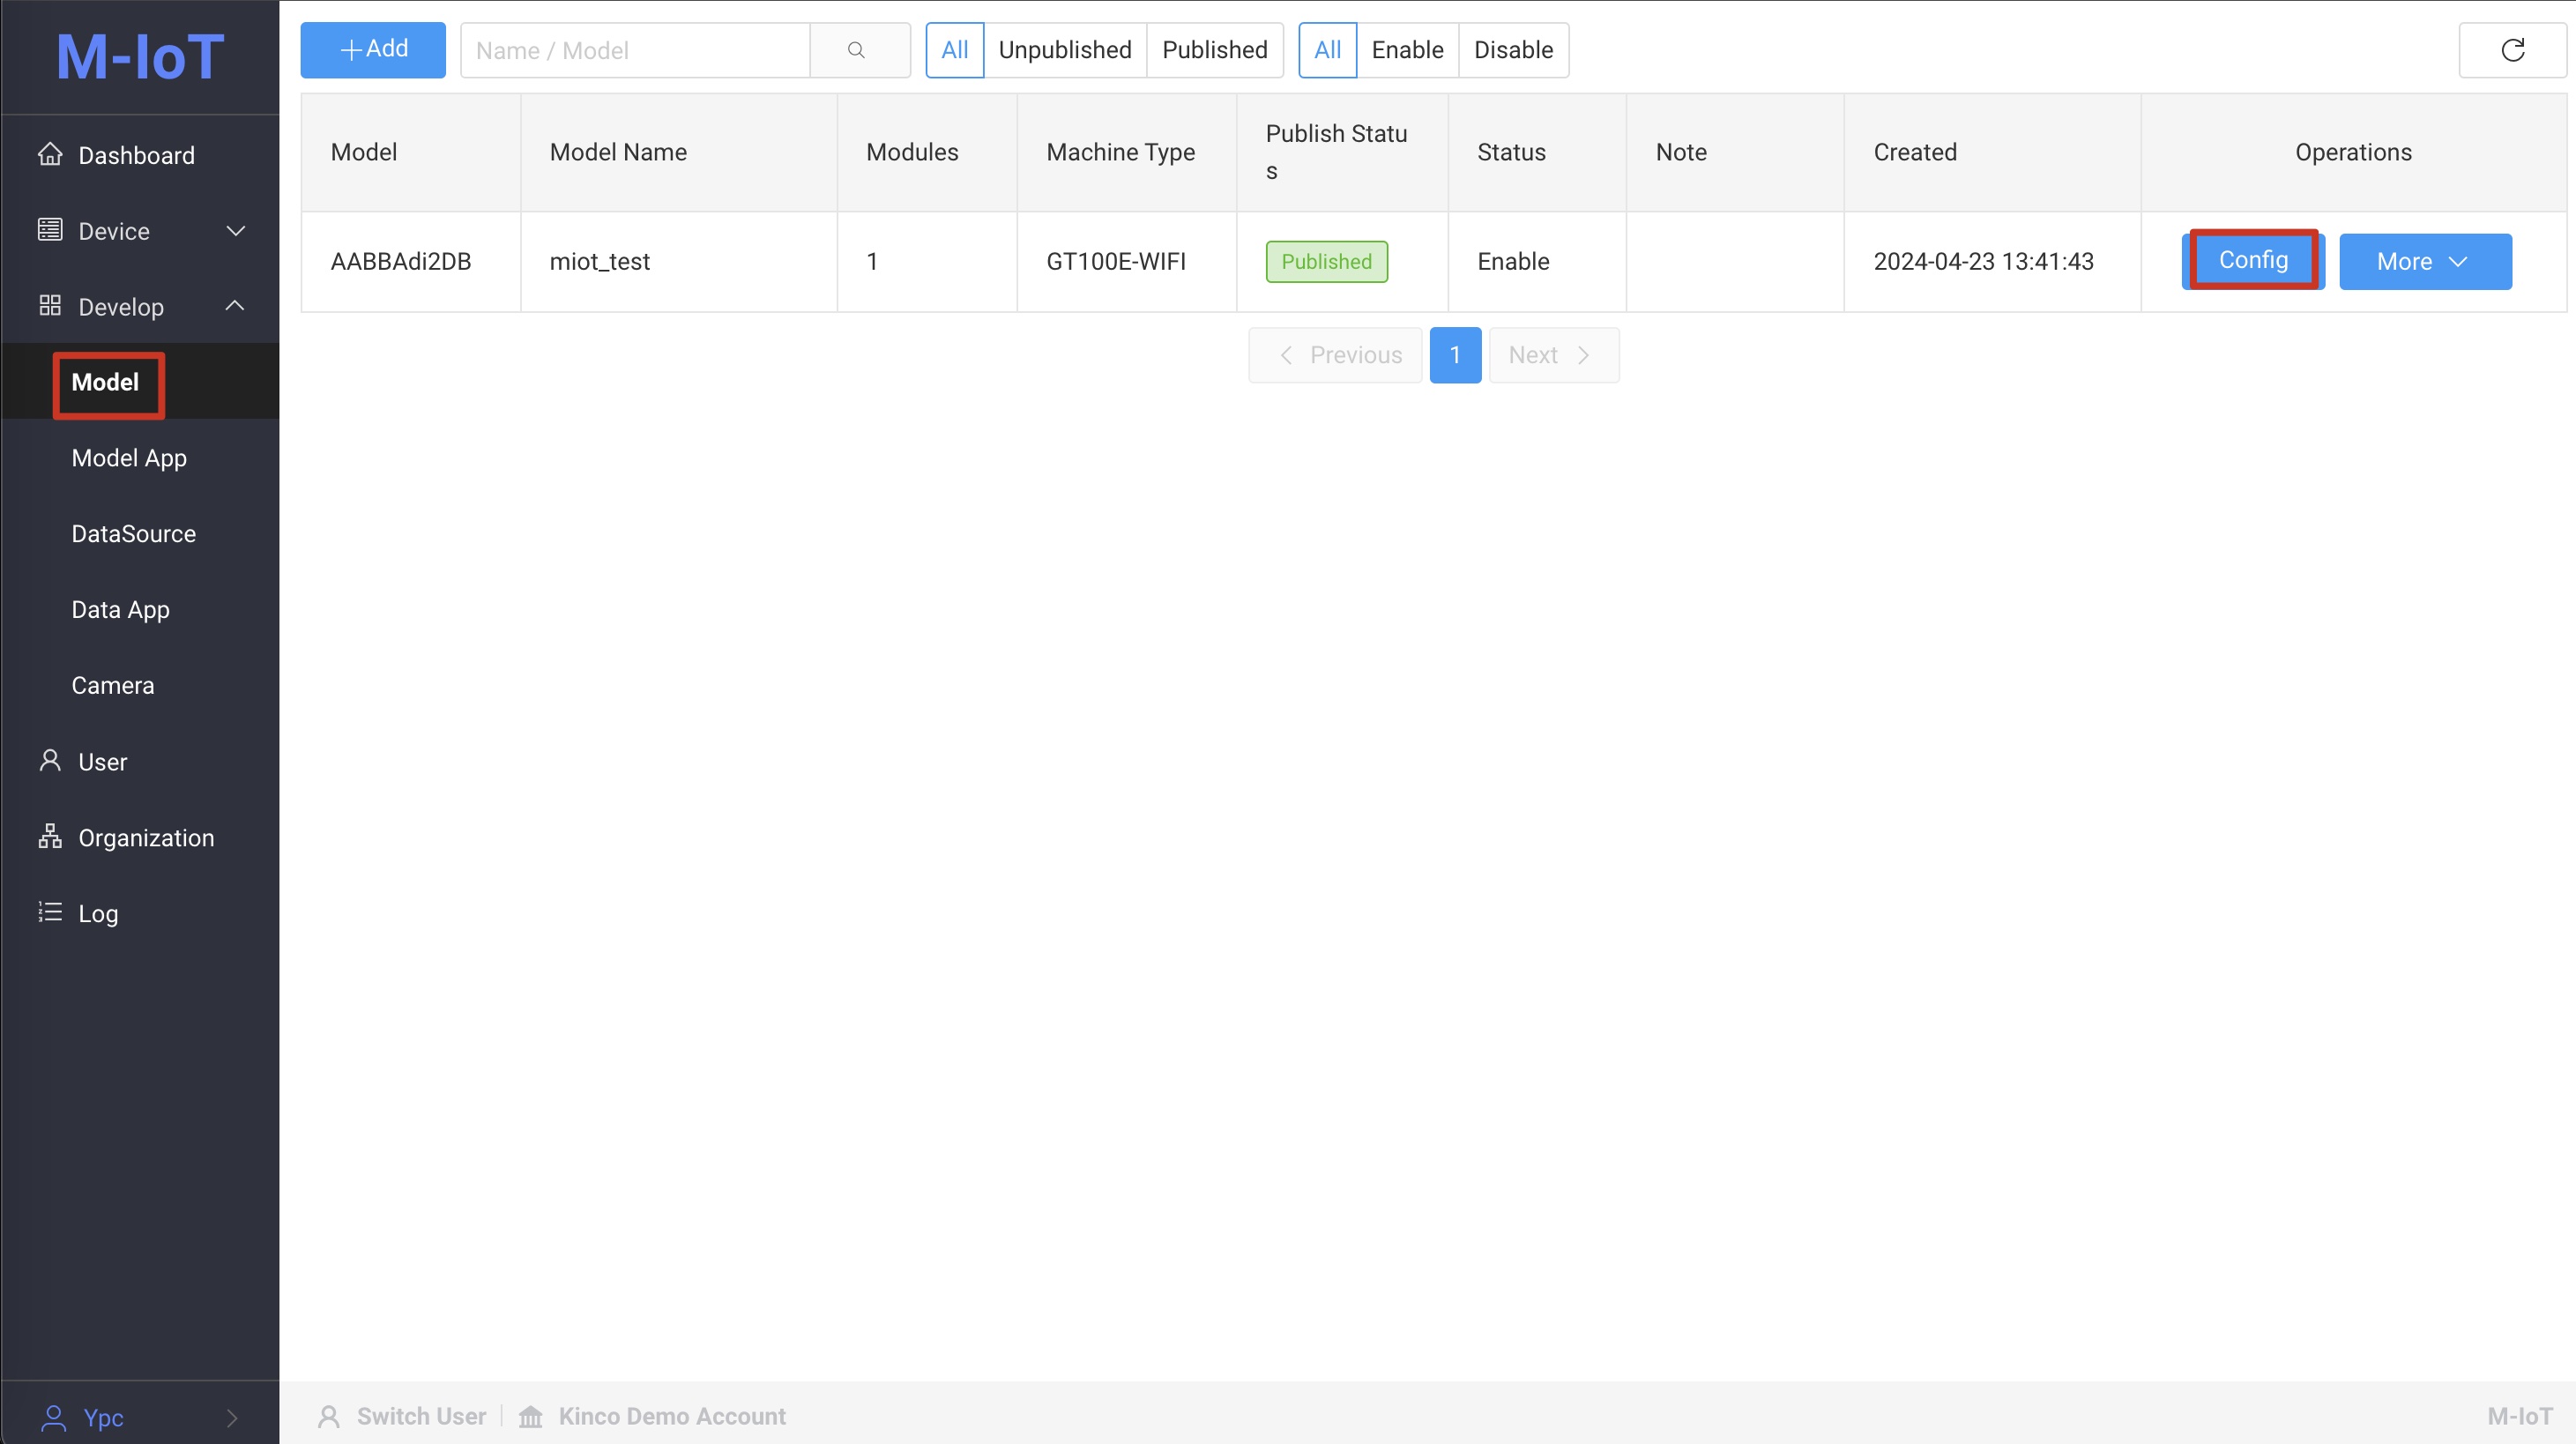
- Select the
Modulestab to view the IX data
Output type data example
Single Value
1000
Object Array
[
  {
    "id": "1001",
    "name": "name1"
  },
  {
    "id": "1002",
    "name": "name2"
  }
]
Single Value Array
[1, 2, 3]
Object
{
  "id": "1001",
  "name": "name1"
}