Configure Data Source
Configure the data source of the corresponding component
There are two types of components for configuring data source. One type can only configure data sources (such as tables, bar, and line), and the other type can configure data sources and can also be manually input (such as text, number, and progress).
-
Component data can only come from data sources

-
Component data can come from data sources or be entered manually

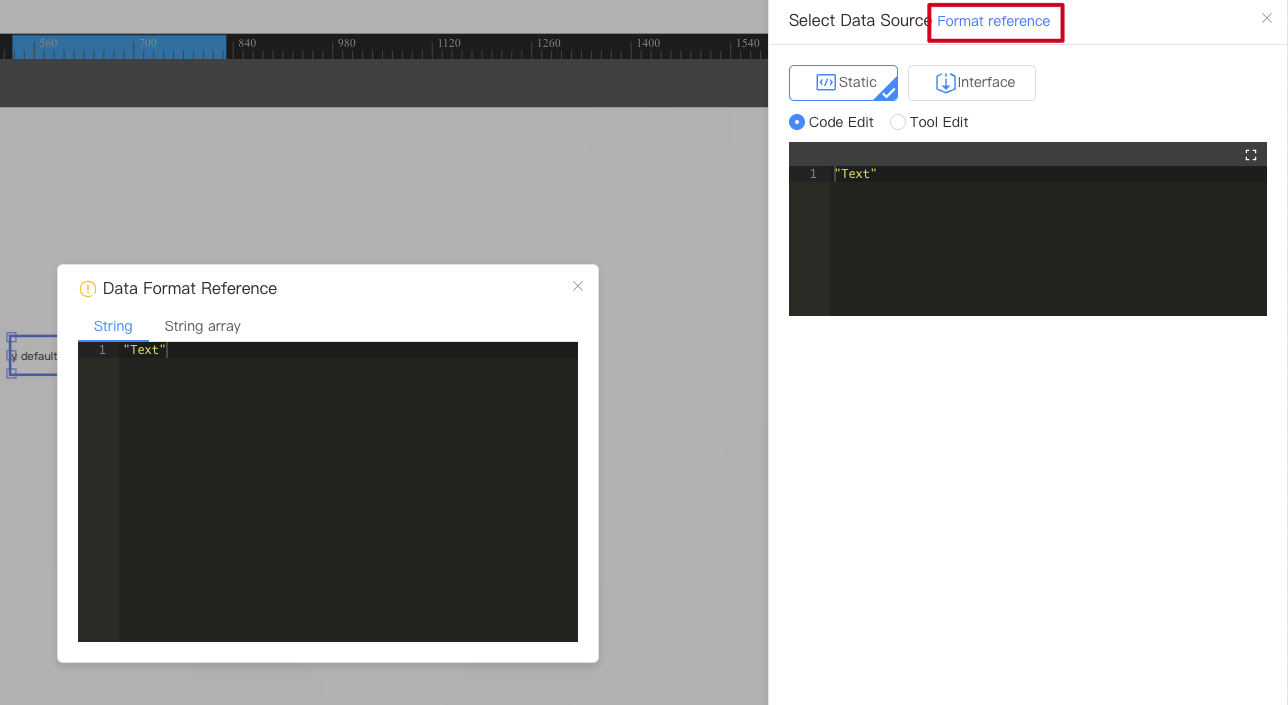
Format reference
According to the data structure reference provided by the system, create corresponding static data or interface data according to your own needs
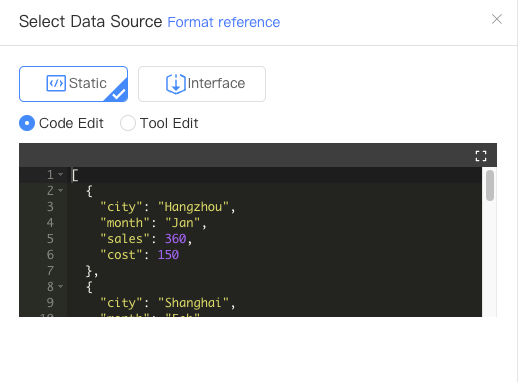
Static Data
Code Edit
The default display is sample data that meets the current component data format, which can be modified Click the zoom icon in the upper right corner of the editor to enlarge the editor
Tool Edit
Generate a json array in a visual form
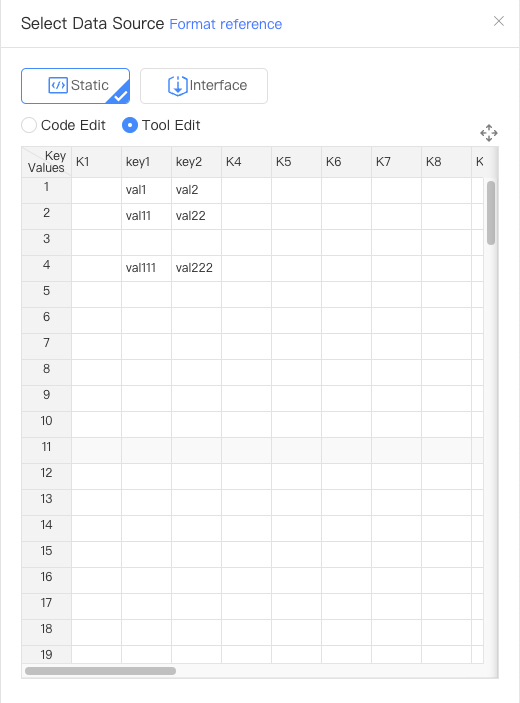
Reference:The json array corresponding to the above picture is
    [
        {key1:val1,key2:val2},
        {key1:val11,key2:val22},
        {key1:'',key2:''},
        {key1:val111,key2:val222}
]
Interface Data
System
System built-in data source
-
Data source details
-
Total number of devices
- Device page:Total number of devices under the current device page model
- Board page:Total number of devices under all models in the current board organization
-
Number of online devices
- Device page:Number of online devices under the current device page model
- Board page:Number of online devices in all models under the current board organization
-
Number of offline devices
- Device page:Number of offline devices under the current device page model
- Board page:The number of offline devices in all models under the current board organization
-
Device online rate
- Device page:Device online rate under the current device page model
- Board page:The online rate of all devices in the current board organization
-
Number of new devices added this month
- Device page:The number of new devices added this month under the current device page model
- Board page:The number of new devices added this month under all models under the current board organization
-
Monthly growth trend of device (12 months)
- Device page:The number of new devices added per month in the past 12 months under the current device page model
- Board page:The number of new devices added monthly in the past 12 months for all models under the current board organization
-
Daily active devices
- Device page:Number of active devices on the day under the current device page model
- Board page:The number of active devices on the day under all models under the current board organization
-
Monthly active devices
- Device page:Number of active devices in the current month under the current device page model
- Board page:The number of active devices in the current month under all models of the current board organization
-
Device quantity statistics by model (pie chart)
- Device page:Statistics of the number of models under the current device page model
- Board page:Statistics of the number of models under all models in the current board organization
-
Query device information
- Device page:Current device information (machine, name, geographic coordinates, address information, organization)
-
Number of device running
- Device page:The number of devices currently running under the current device page model
- Board page:The number of devices currently running under all models under the current board organization
-
Number of device downtime
- Device page:The number of devices currently down under the current device page model
- Board page:The number of currently down devices in all models under the current board organization
-
Device fault list
- Device page:Current device fault list (configurable to filter the last
how manydays, return a list offault timeandfault content)
- Device page:Current device fault list (configurable to filter the last
-
Device fault snapshot
- Board page:List of device fault in all models under the current board organization (returns a list of
fault time,fault contentandfault device)
- Board page:List of device fault in all models under the current board organization (returns a list of
-
Device Snapshot
- Board page:Filter the current board page organization under
Specified model,Specified devicebyDevice IoT status,Device operating status,Device available status, whether the returned data containsEnvironmental parameters, running parameters, fault parameters, set the filtering conditions and clickGet Sample Datato get sample data again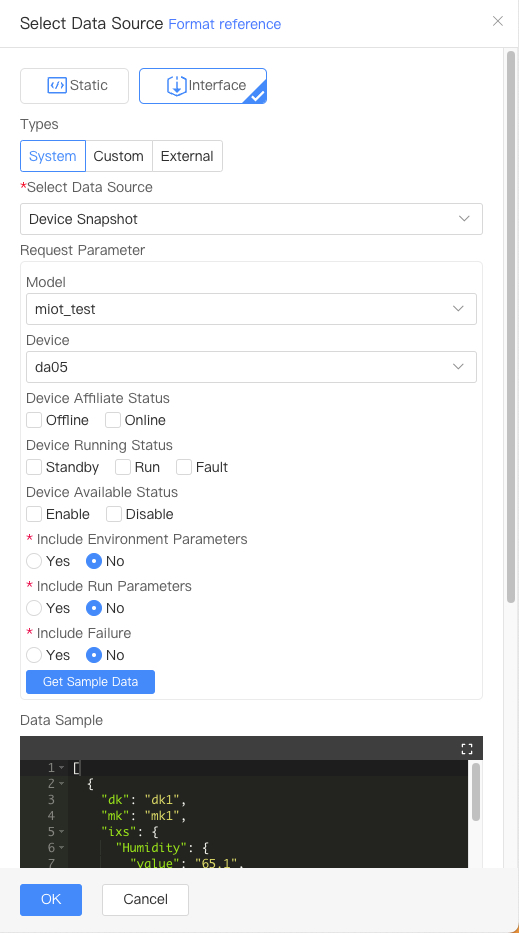
- Board page:Filter the current board page organization under
-
Device data update time (when data is updated, components in the screen that reference this data source will be updated in real time)
- Device page:Current device data update time
- Board page:Update time of
specified devicein all models under the current dashboard organization
-
Device IoT status (when data is updated, components in the screen that reference the data source will be updated in real time)
- Device page:Current device online status
- Board page:Online status of
specified devicein all models under the current board organization
-
Real-time parameter values (when data is updated, components in the screen that reference the data source will be updated in real time)
-
Device page:The value of the current device's
specified parameter -
Board page:The value of
specified parameterunderspecified deviceunder all models under the current board page organization
Send Data Please refer to Send parameters through DV screen in Send parameters to HMI through the platform
Matching code table Please refer to the code table in the data model
-
-
-
For details, please refer to:
System Data Sourcein System Data Source
Custom
Custom Data Sources
- For details, please refer to:
Custom data sourcein Device data source/Dashboard data source
External
Data sources provided by other systems
- For details, please refer to:
External Data Sourcein Data Source
Configuration Process
- Select the corresponding type of interface according to the scenario
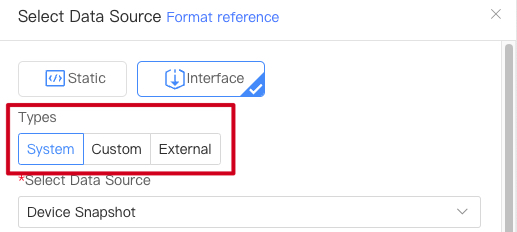
Recommended or not will be displayed based on the data type
-
Select the corresponding data source according to business needs

Click the zoom icon in the upper right corner of the data sample to zoom in on the sample> Custom type interface, click the refresh icon in the upper right corner of the data sample to refresh the data sample
-
Refer to the sample data and do data format. The current system provides 3 convenient methods
- Default Value
- Percentage
- Keep Decimal
- Time format (only parameter named
tscan be formatted by time format)
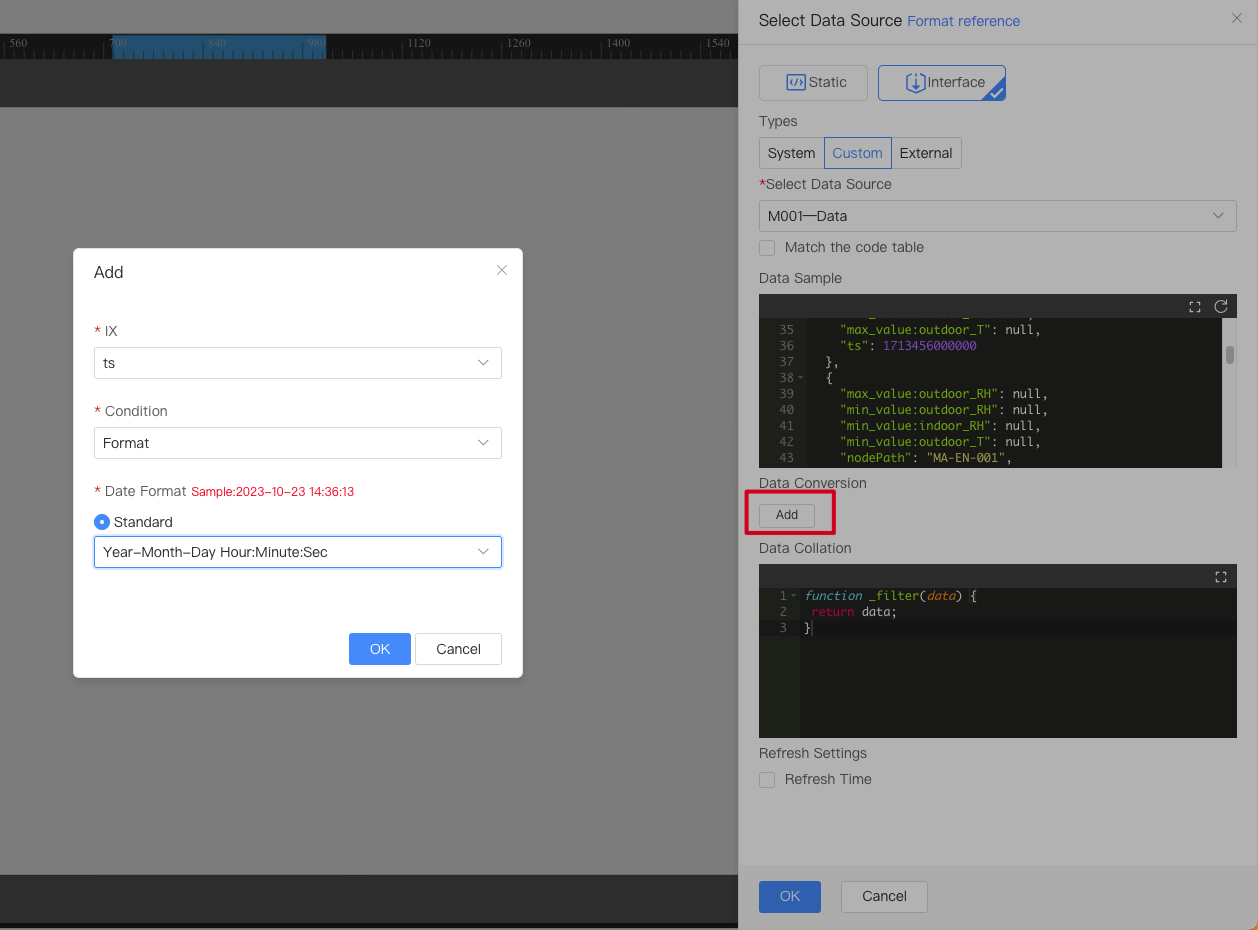
-
Use the programming tools provided by the system to achieve more complex data processing. A certain JS programming foundation is required.
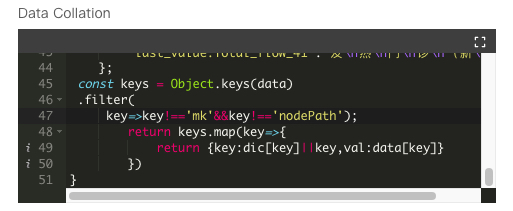
Click the zoom icon in the upper right corner of the editor to zoom in and edit.
-
Check "Refresh Time" to configure the cycle time for obtaining data
