Statistics of the average temperature, maximum temperature, and minimum temperature of each day in the last 1 month
Scenario
This case describes how to configure the data source to display the average temperature, maximum temperature, and minimum temperature of each day in the last 1 month. After the data source configuration is completed, the data is generally displayed using charts or table components.
Prerequisites
- The model has been created on the M-IoT platform;
- The temperature sensor has collected temperature data to the M-IoT platform;
Implementation steps
In Admin mode, click the Data Sources submenu under Development Management in the left menu.
⚠️ Notes:The model in this case is named demo, which contains the temperature indicator set_T. The parameter configuration is configured according to the content circled in red
This case uses device data source as an example
- Select
Device Data Source, clickAddto enter the configuration interface, and clickOKafter the configuration is completed.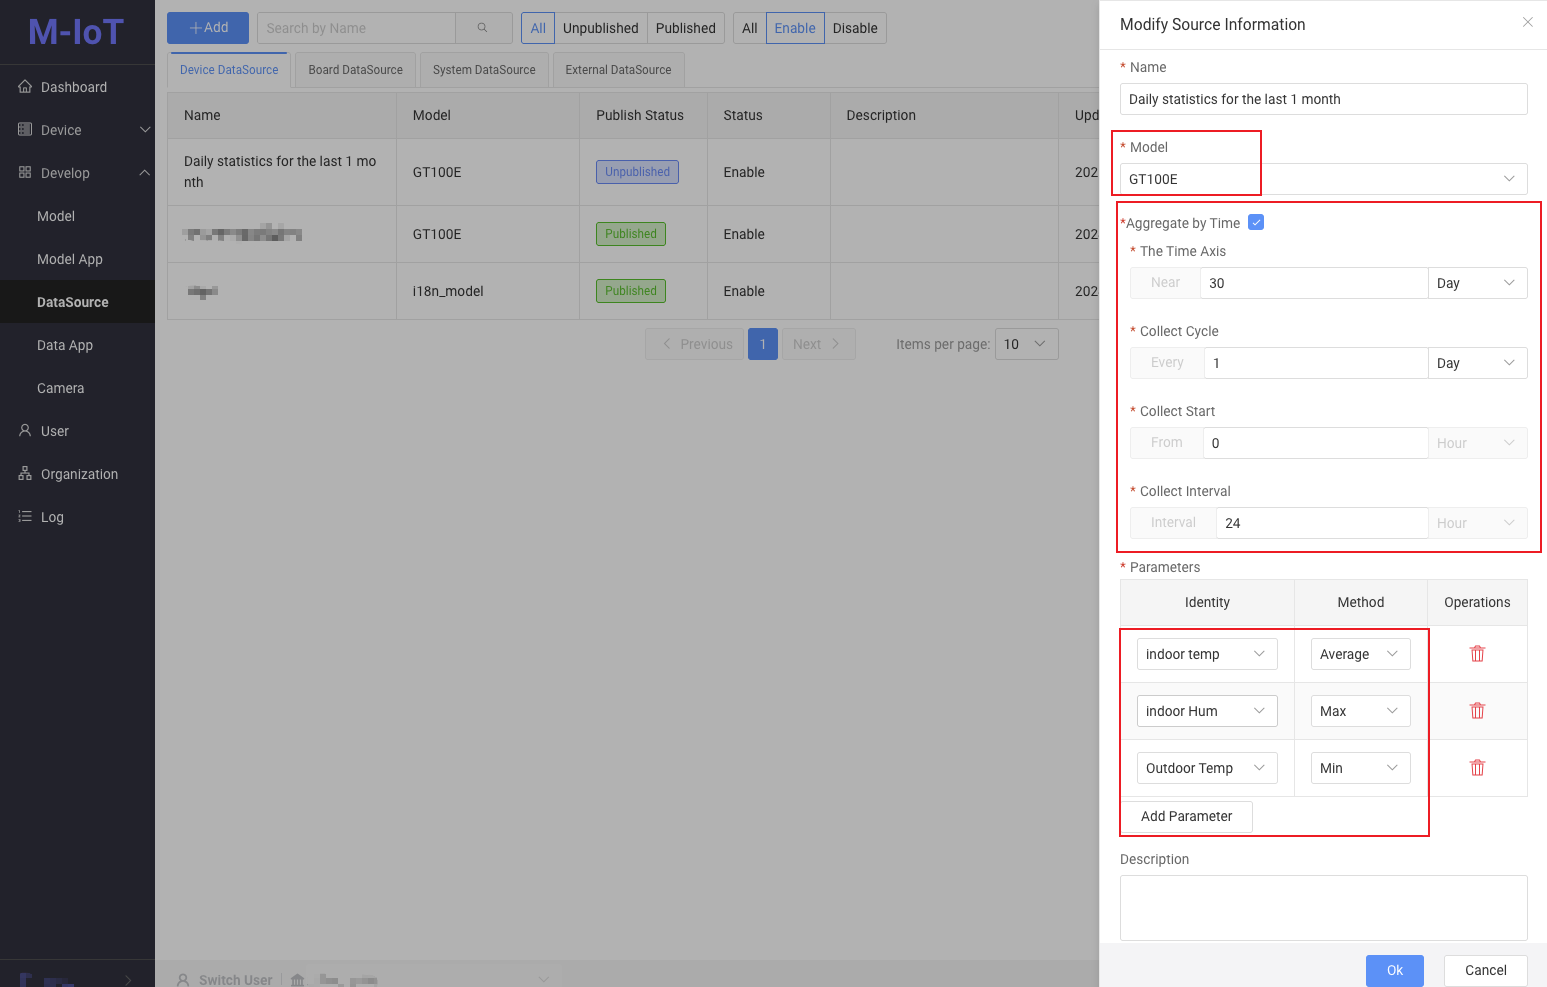
- Time dimension: Click the radio button after the time dimension to display the time dimension parameters
- Time period: Statistics for the past 30 days
- Collection cycle: once a day
- Collection start and collection interval: Count the temperature from 0:00 to 24:00 every day. Fill in according to the actual situation. For example, if the effective statistical time is from 8:00 am to 18:00 pm every day, fill in 8 and 10 respectively.
- Parameters: Click the Add Parameter button to add three parameters, namely:
- Temperature settings, aggregation mode averages.
- Temperature setting, maximum value of polymerization mode.
- Temperature setting, minimum value for polymerization mode.
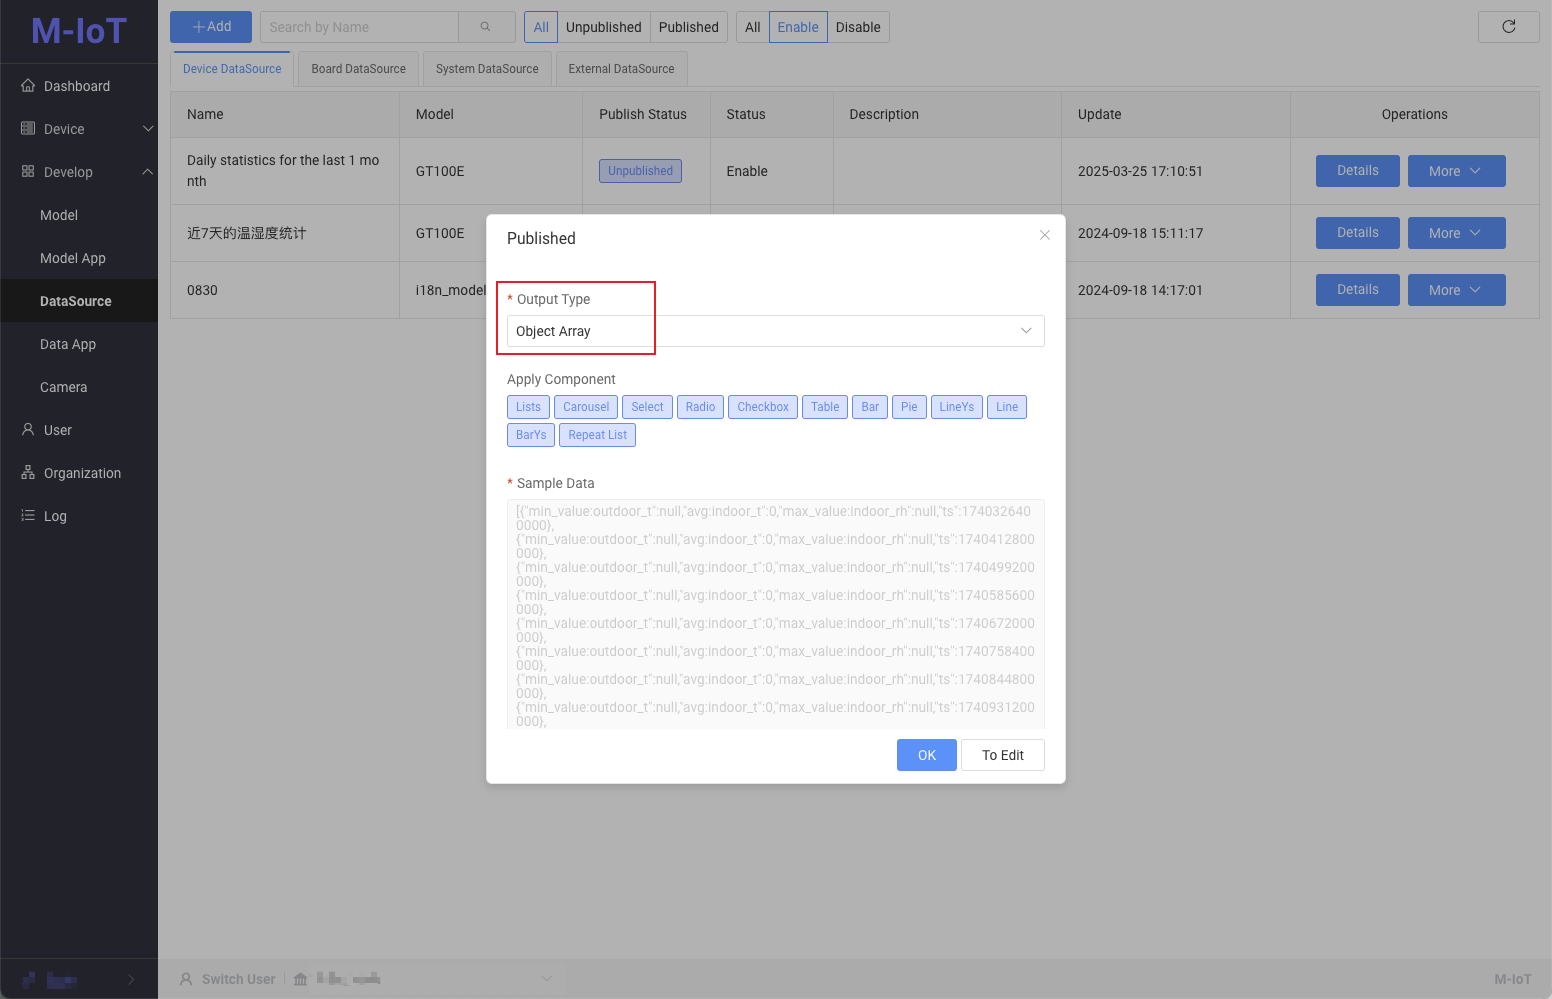
- On the data source publishing page, select Object Array for Output Type and click OK.
⚠️ The difference between Device Page and Dashboard Page is that the Dashboard Page can be configured with multiple models, while the Device Page can only be configured with one model.