Device Monitor Case
Scenes
A power plant needs an Device monitor screen to view power plant device data in real time.
Prerequisites
- Power generation data has been collected in real time on the M-IoT platform;
- The data application has been created on the M-IoT platform (either on the device page or the dashboard page);
Implementation Steps
In Admin Mode, click Data Applications' under Development Management in the left menu and click the Design' button in the Operations' column of the Data Applications' list to enter the visual configuration interface,
for component configuration.
Device Page
-
Select
Device Pageand clickDesignto enter the visual configuration interface.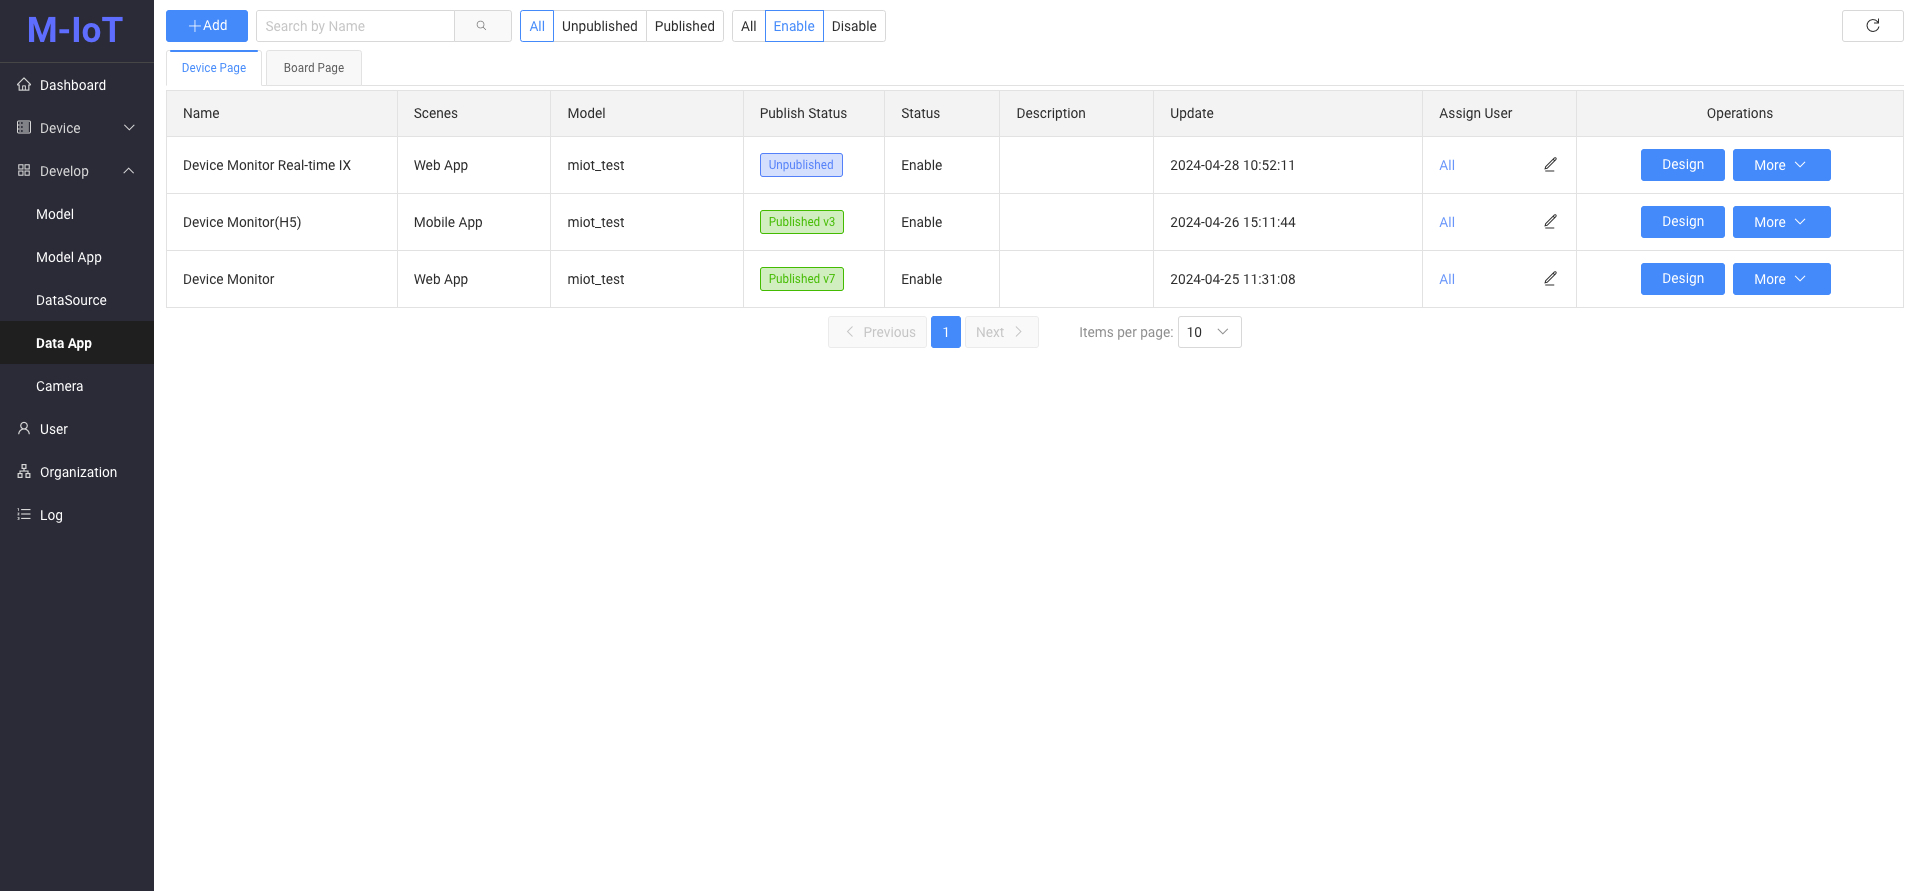
-
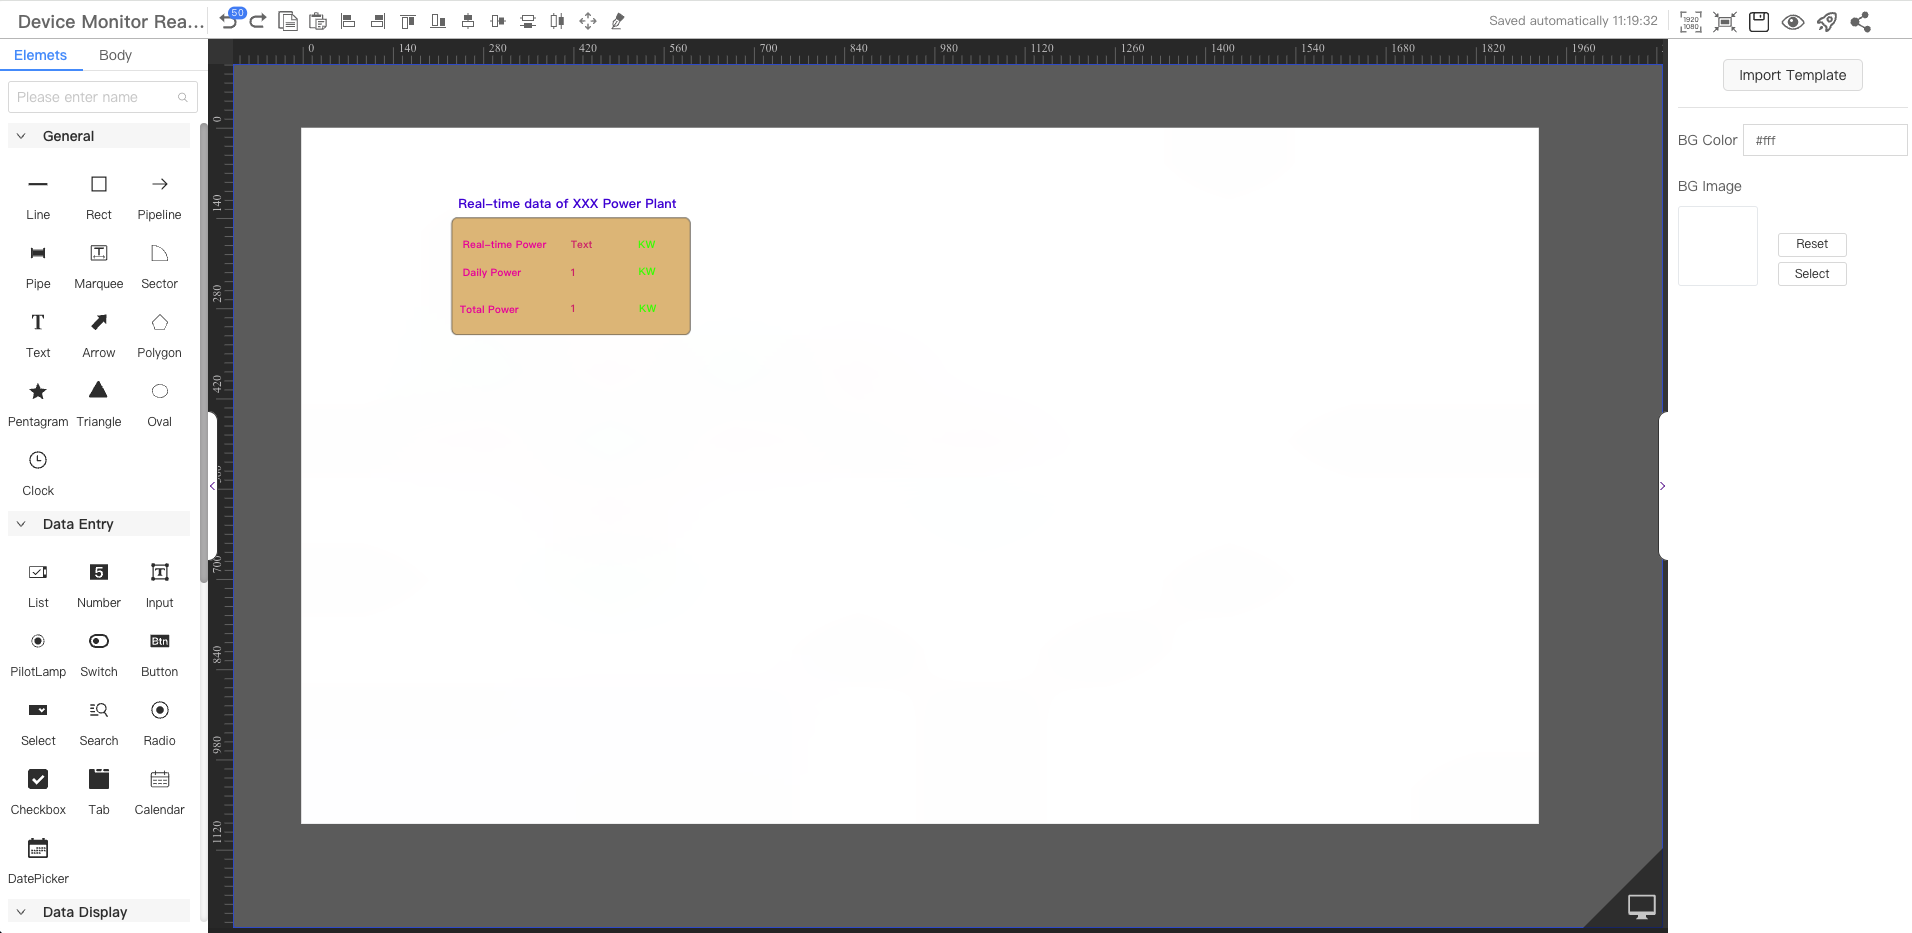
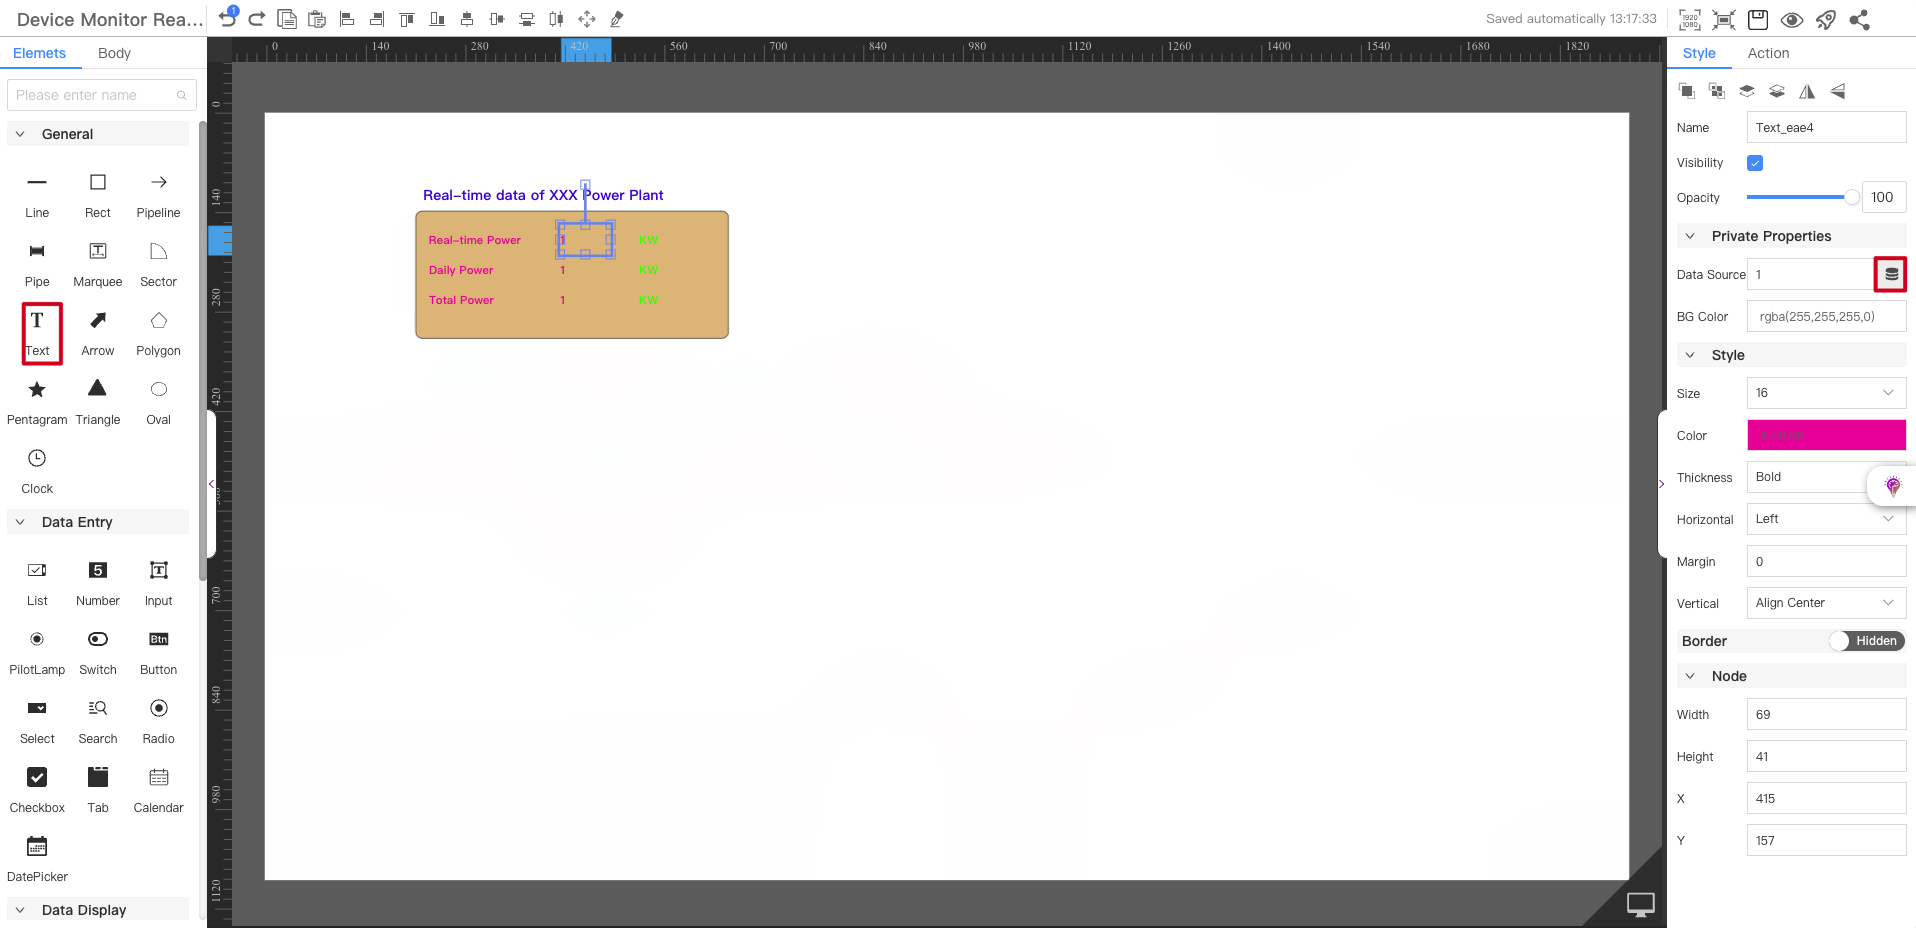
From the component library on the left, select the Text component and drag it onto the canvas. Select the component and in the Display Data style on the right, click the icon next to it to configure the data source.
-
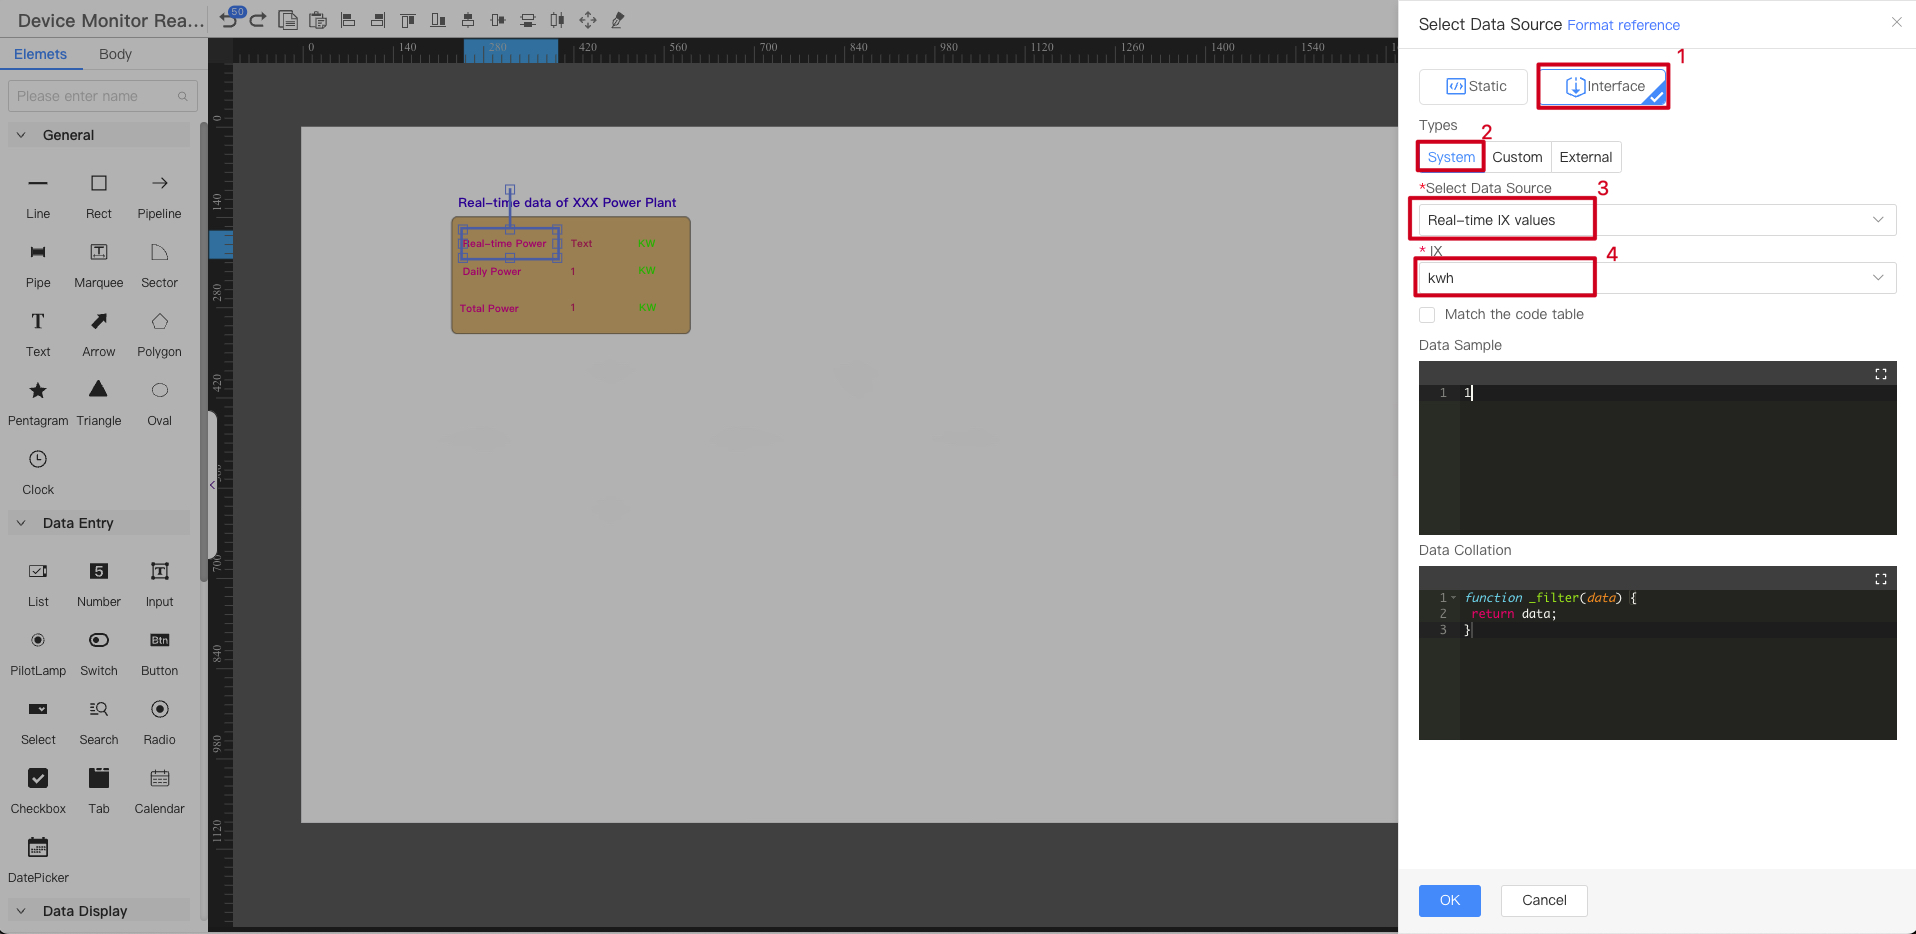
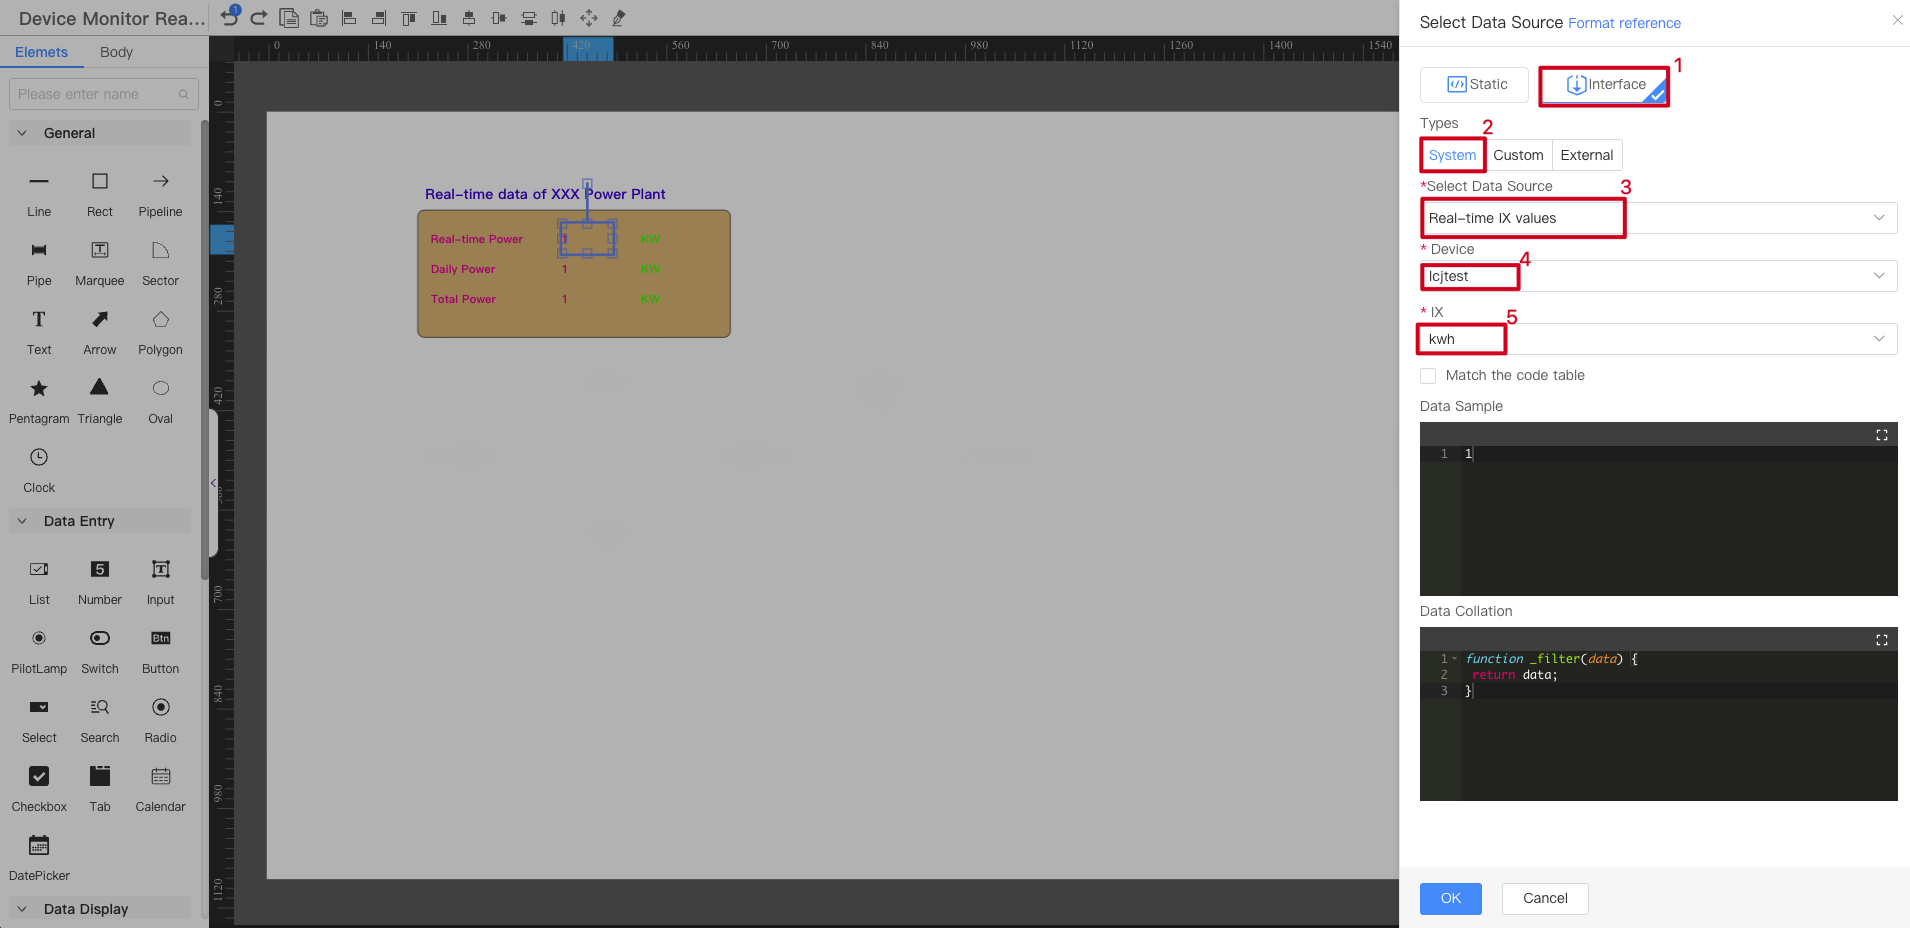
The data source configuration interface pops up, configure the device parameters to be monitored, refer to the sequence number in the figure below
-
Select the
Interfacedata source -
Select the System type data source
-
Select the
Real-time parameter valuedata source -
Select the parameter indicators to be monitored (The parameters of the object model selected when creating the device application)
Dashboard page
-
Select
Banner Pageand clickDesignto enter the visual configuration interface.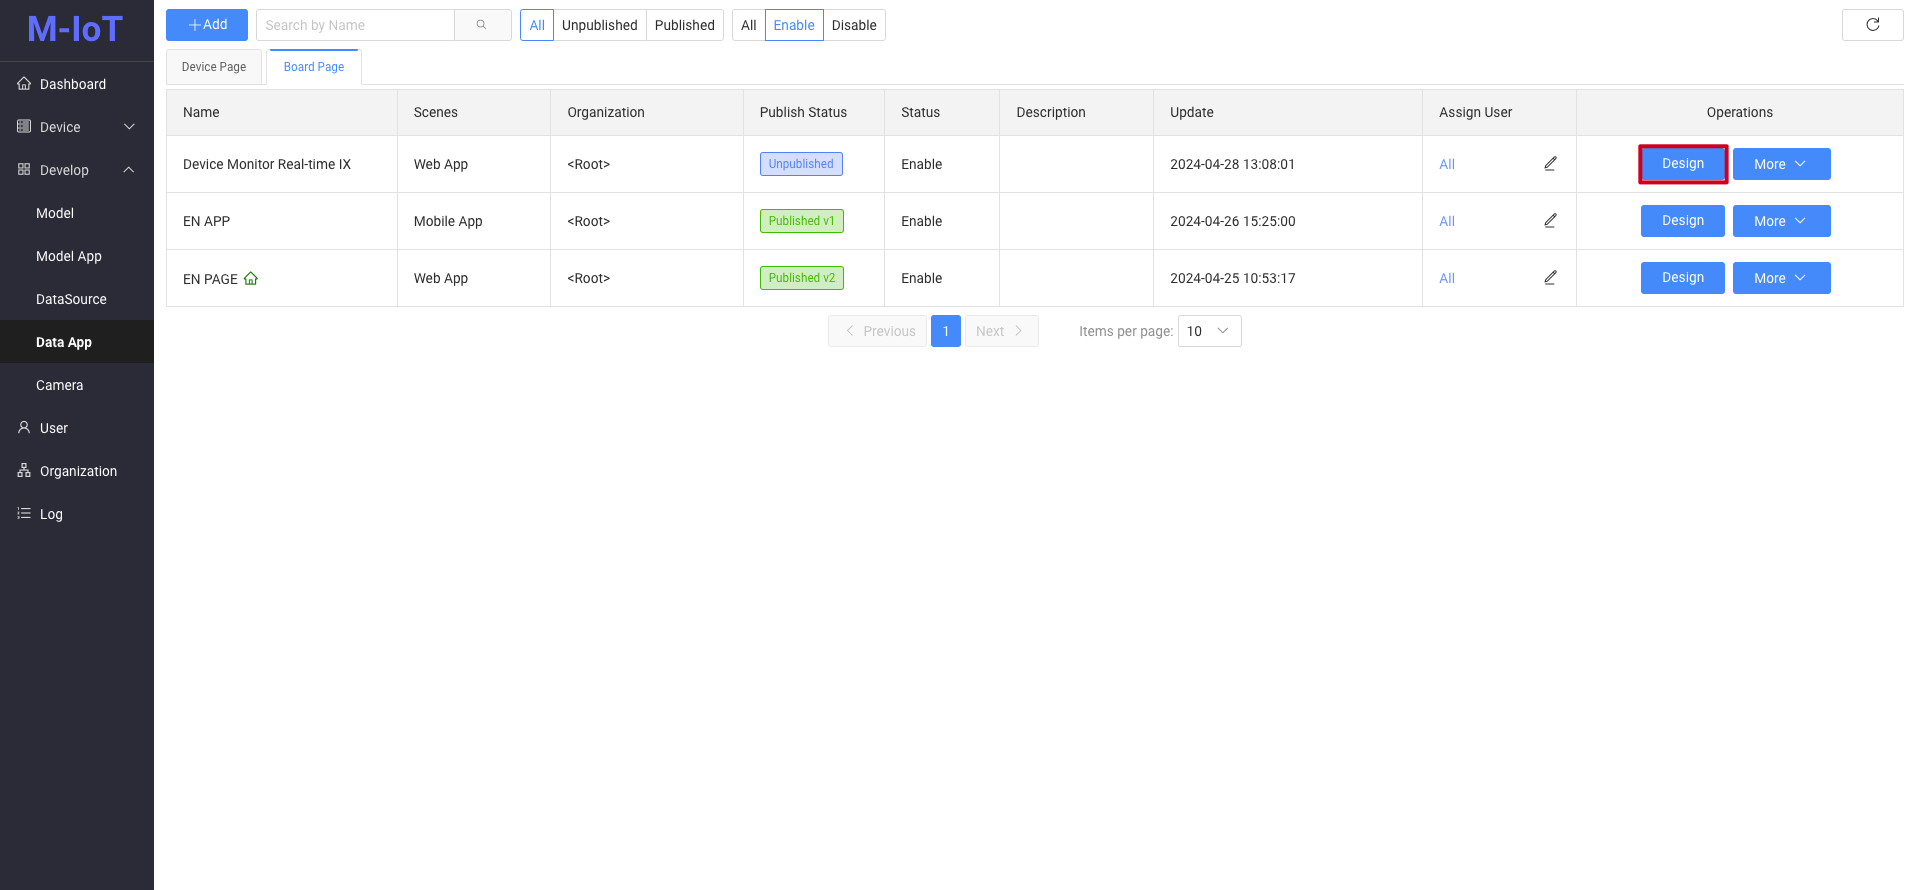
-
From the component library on the left, select the Text component and drag it onto the canvas. Select the component and in the Display Data style on the right, click the icon next to it to configure the data source.
-
The data source configuration interface pops up, configure the device parameters to be monitored, refer to the sequence number in the figure below
-
Select the
Interfacedata source -
Select the System type data source
-
Select the
Real-time parameter valuedata source -
Select the device you want to monitor
-
Select the parameter indicators to be monitored (The parameters of the model corresponding to the selected device)
⚠️ The difference between Device Page and Dashboard Page is that the dashboard page needs to be configured to a certain device, while the device page does not.
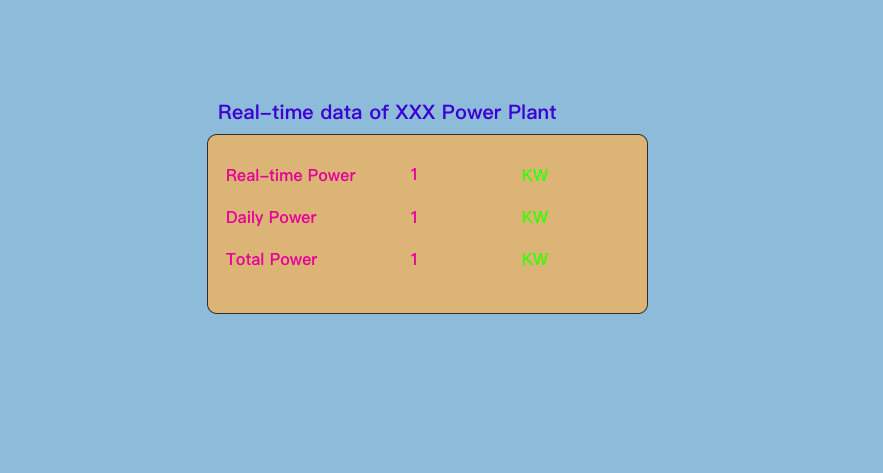
Final rendering effect
When the power level changes, the power data on the page is automatically updated
In this case,
real-time power generation,power generation on the day, andaccumulated power generationare configured respectively. Repeating steps 2 and 3 can achieve the goal