Use the difference to count the oxygen consumption every day in the last 7 days
Scenario
A hospital has some oxygen equipment and wants to count the daily oxygen consumption of oxygen equipment in a certain department on a certain floor in the past seven days.
Prerequisites
The cumulative oxygen data of a department on a certain floor has been collected by M-IoT.
Solution
Turn on the difference switch
-
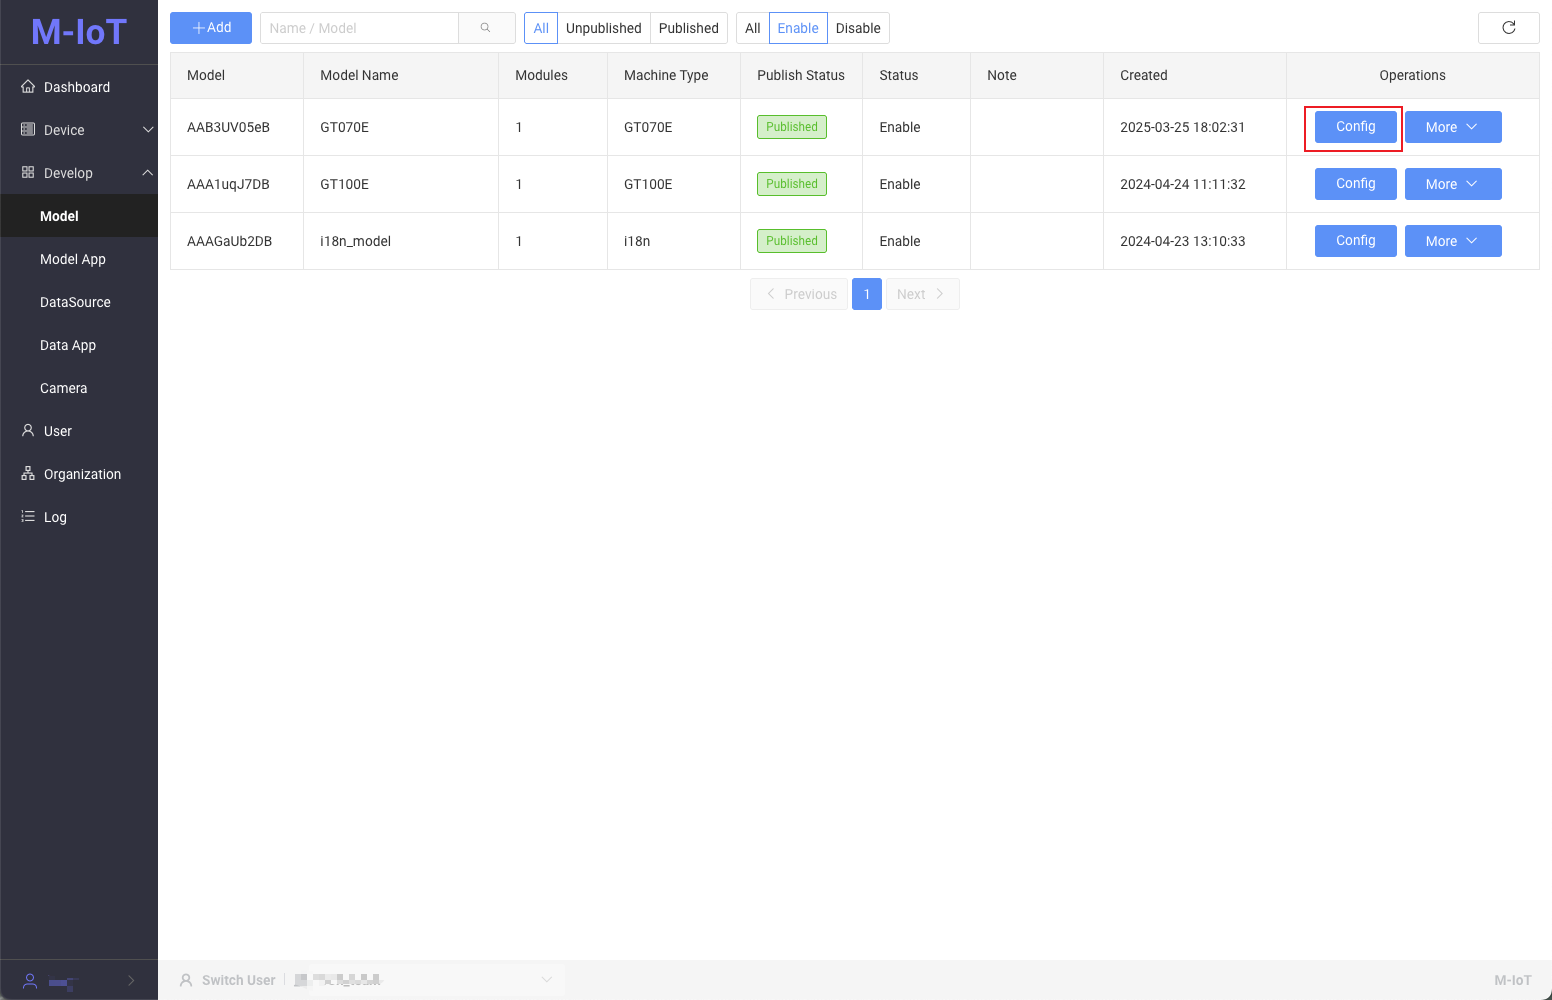
In management mode, click "Development Management" in the left menu, click "Object Model", find the object model you created, and click the "Configure" button in the operation column of the list.
-
After clicking
Configure, find the indicator parameter in the operating parameters that needs to be configured with a difference, the cumulative amount of tumor on the third floor, Only the indicator parameters in the operating parameters can be configured with a difference.
After configuring the difference, the difference is only effective for the current time and the following time, and is not effective for the previous time.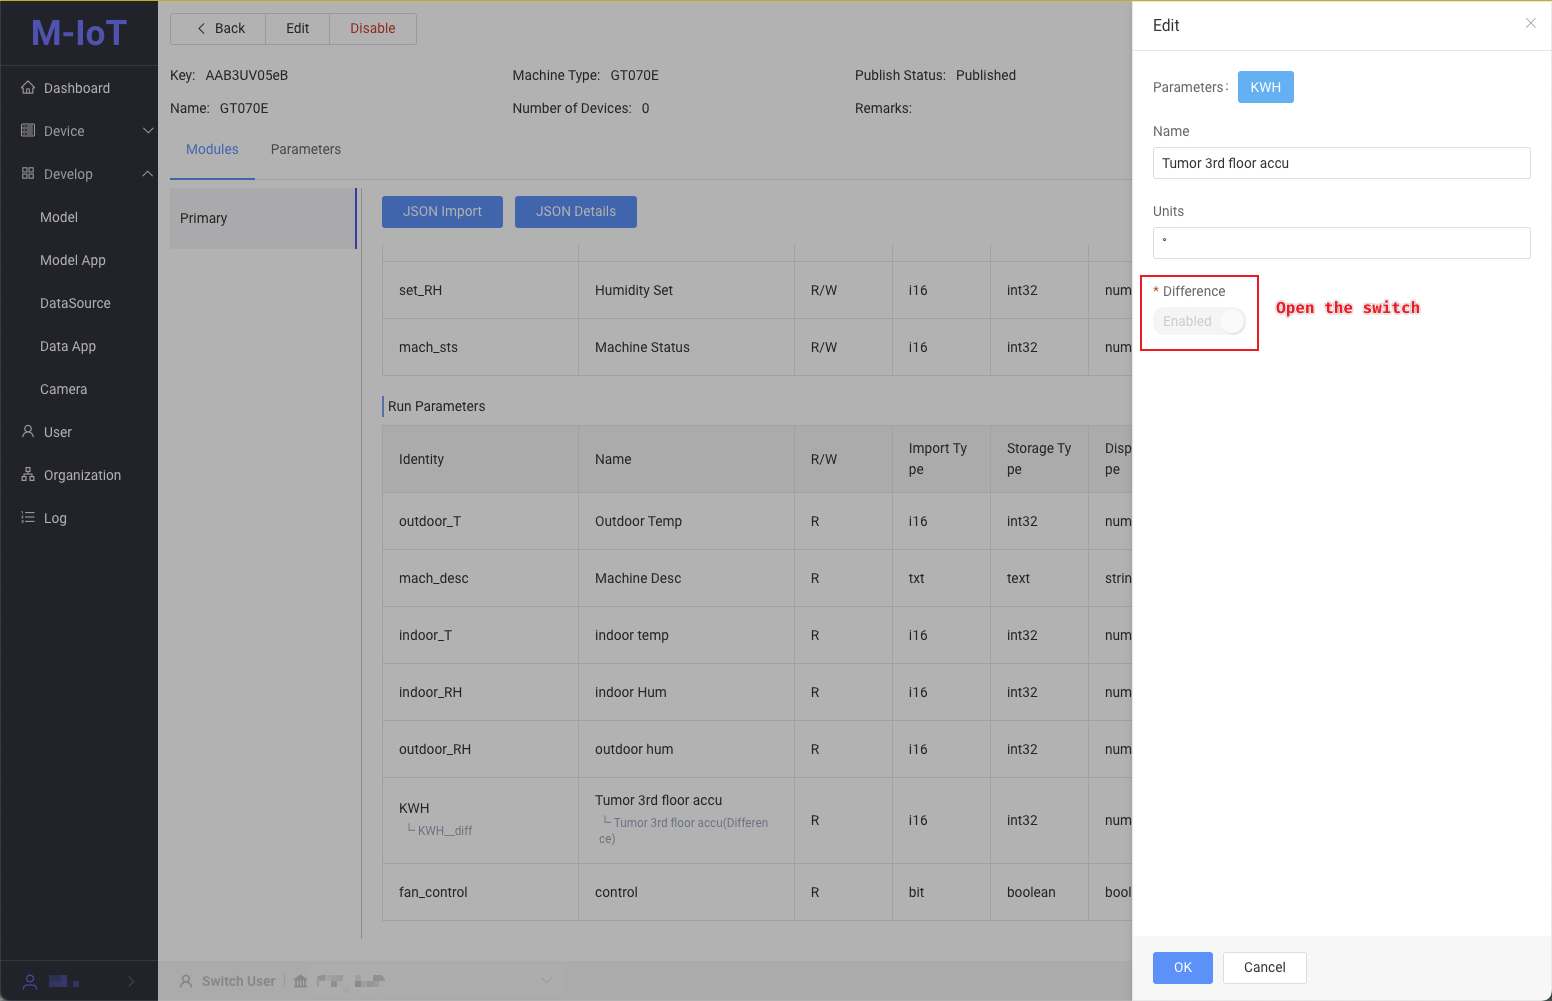
Configure a statistical method for the daily oxygen consumption of a department in a certain building of a hospital in the past 7 days
When the current time is between 0:00 and 24:00, the final value of the day will change, and it will be counted every 5 minutes.Method 1: Directly count by difference.
Method 2: Count by the difference between the final value and the initial value of each day.
The definition of difference is shown in the following table
| Time | Cumulative amount of tumor on the 3rd floor | Difference |
|---|---|---|
| 2024-03-03 | 1227 | 2 |
| 2024-03-02 | 1225 | 2 |
| 2024-03-01 | 1223 | 2 |
| 2024-02-29 | 1221 | 0 |
The difference between 2024-03-03 and 2024-02-29 is: 1227 - 1221 = 6
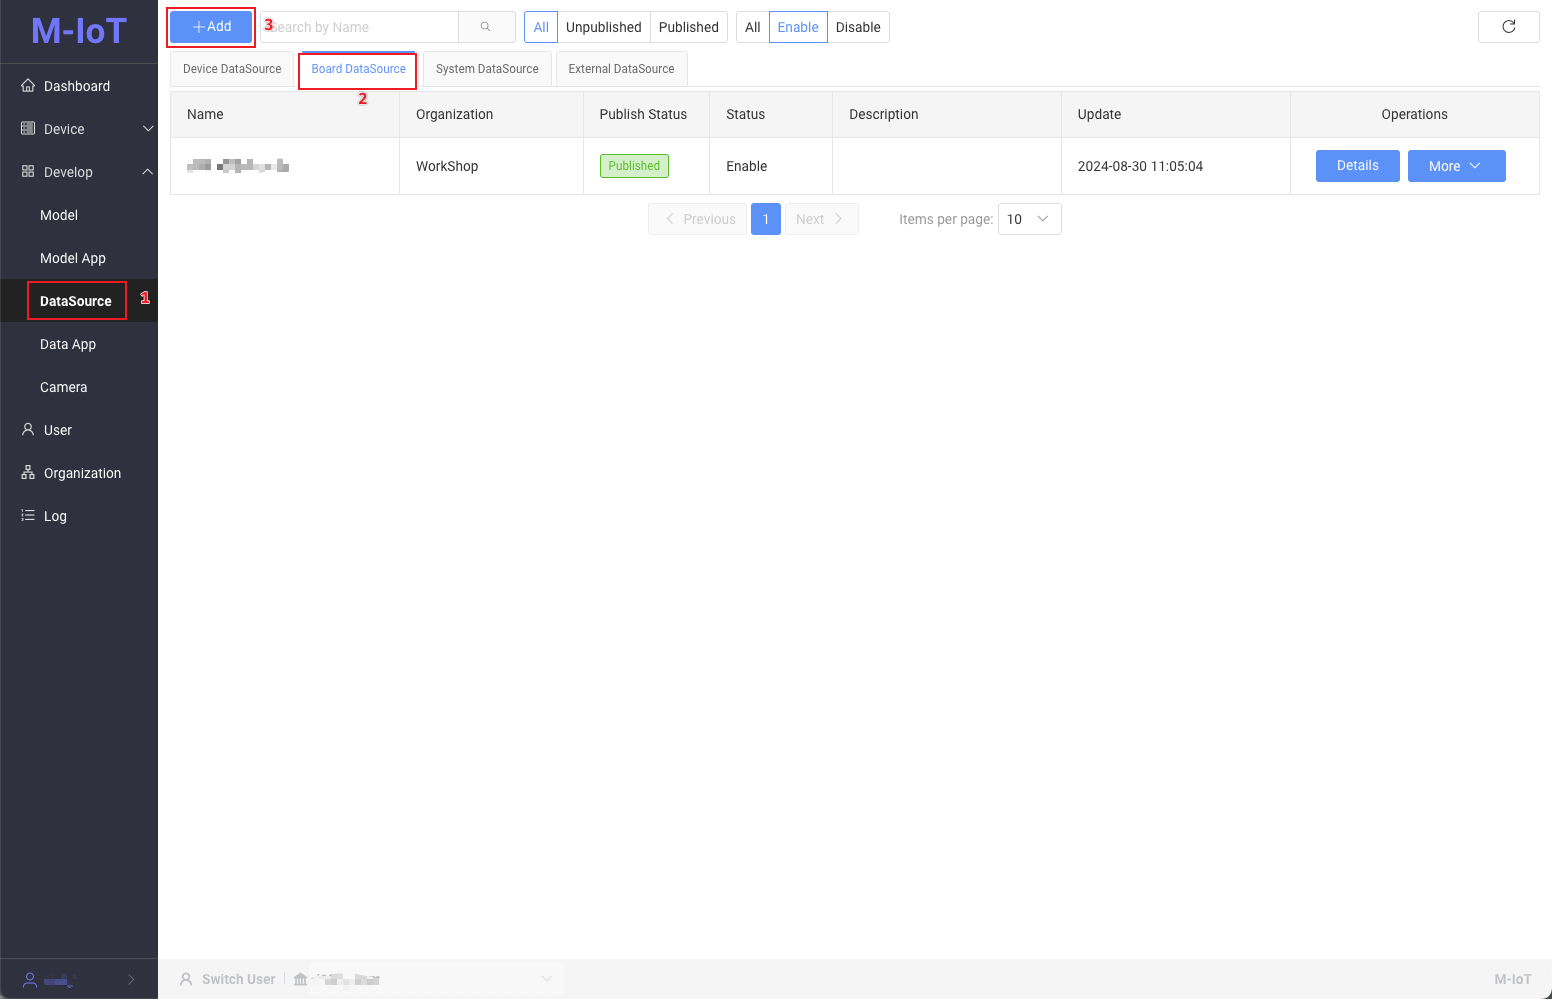
- In management mode, click on "Data Source" under Development Management in the left menu, open the "Data Source" page, switch to "Kanban Data Source", click on the "New" button to create a new data source
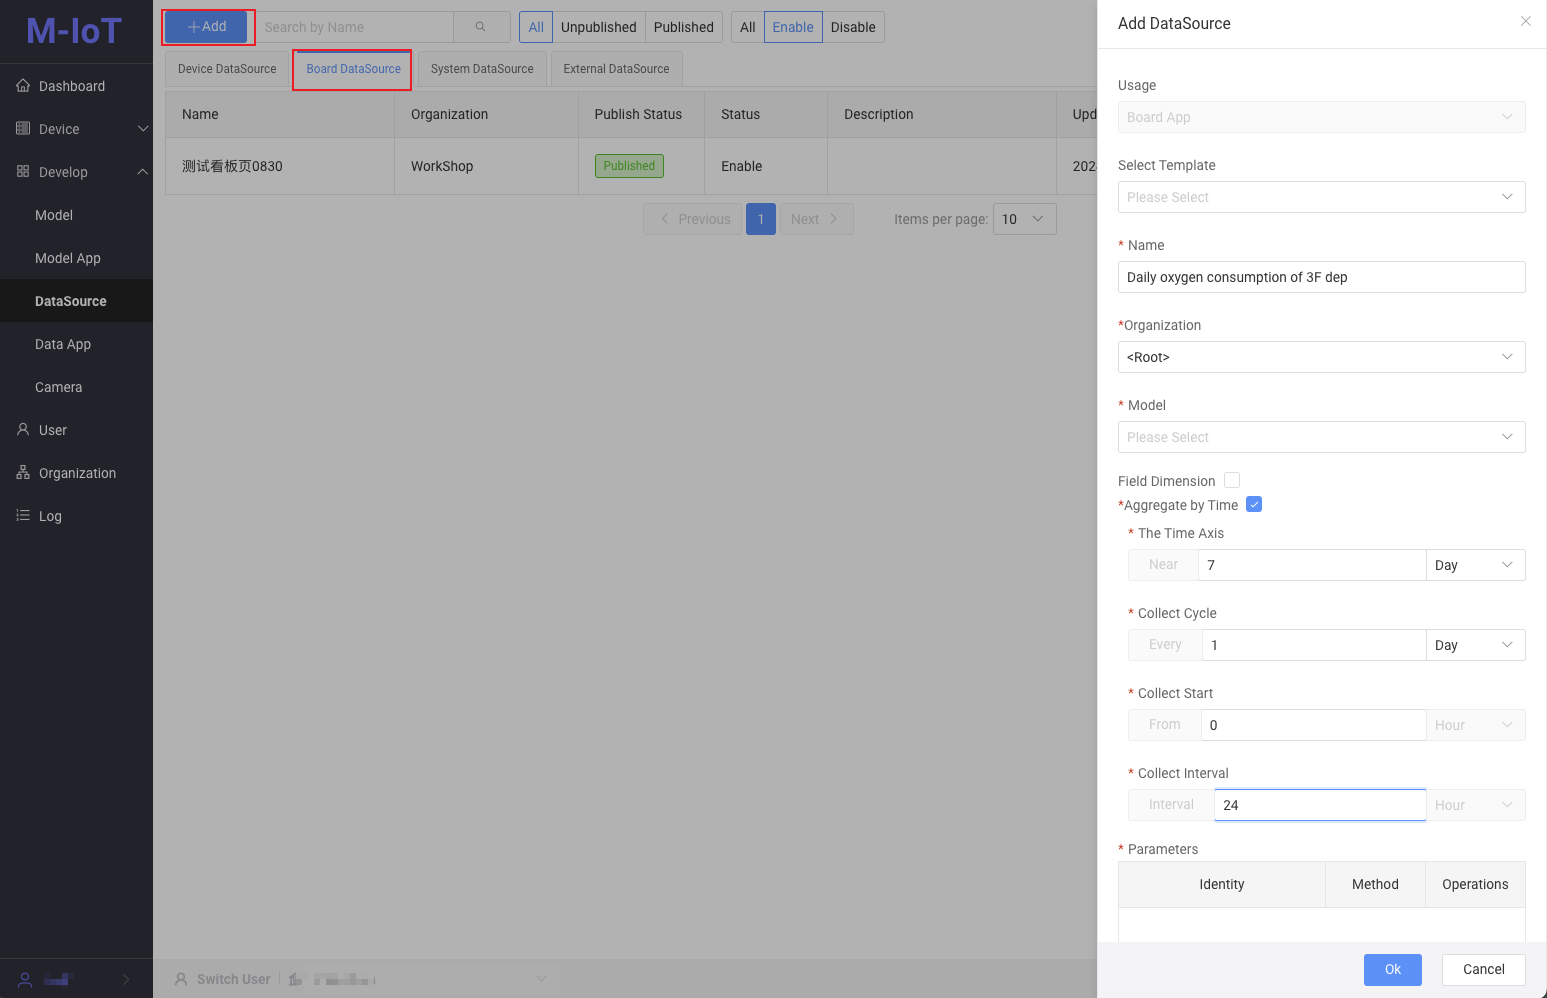
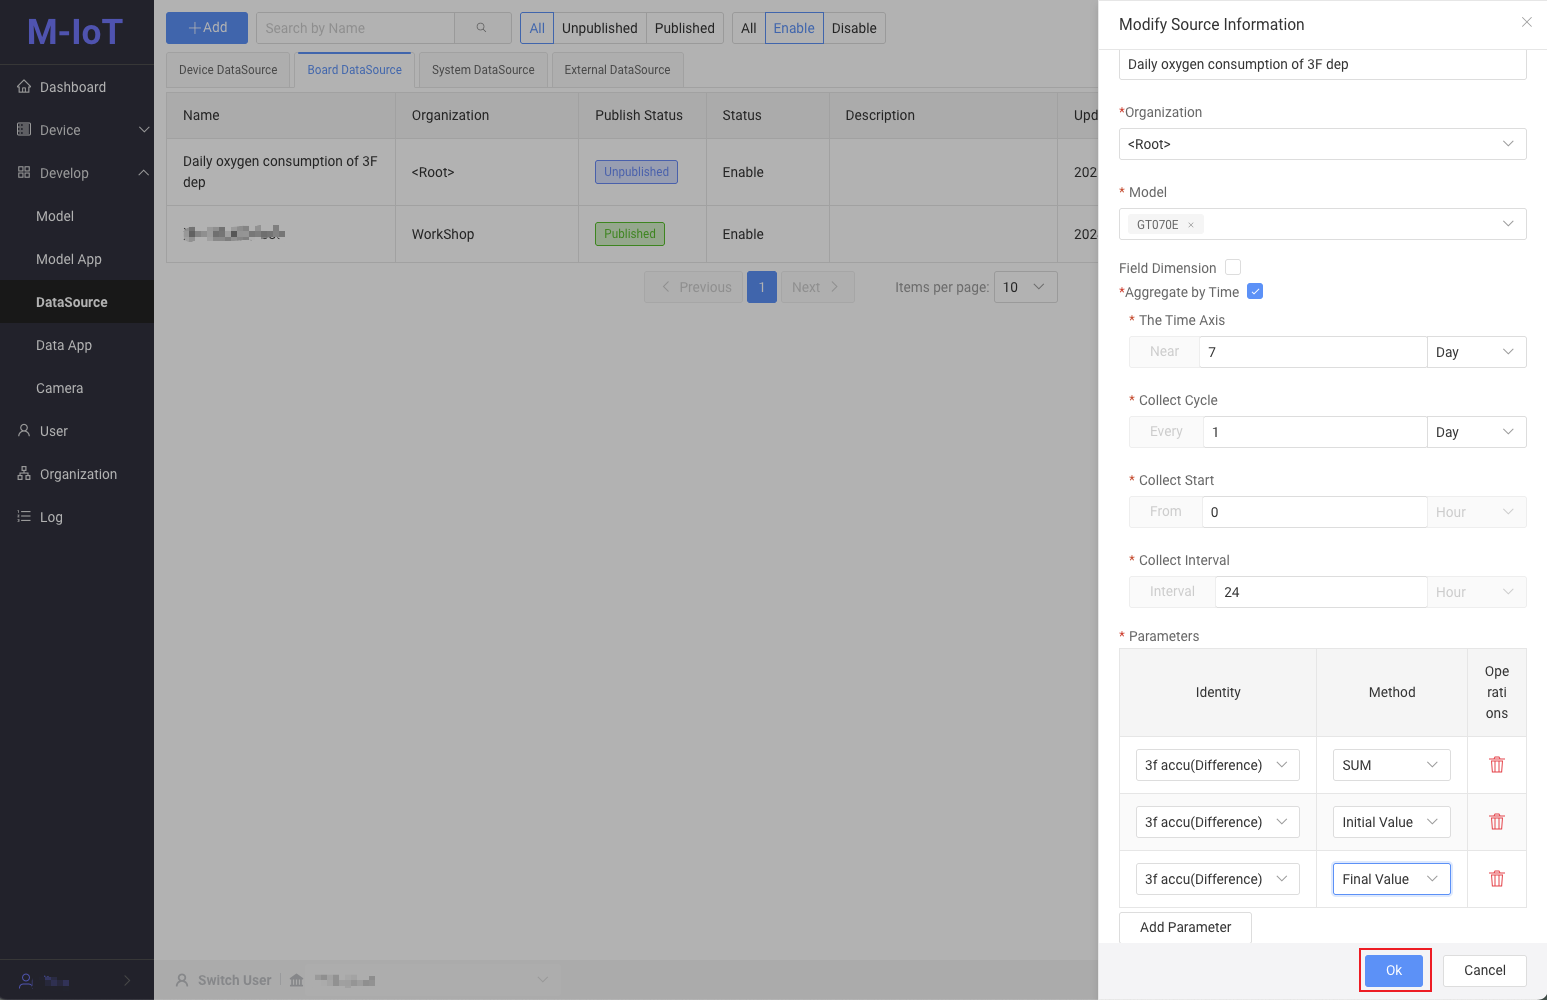
- Time dimension: Click the radio button after the time dimension to pop up the time dimension parameters
- Time period: Statistics for the past 7 days
- Collection cycle: once a day
- Collection start and collection interval: Count oxygen consumption from 0:00 to 24:00 every day. Fill in according to the actual situation. For example, if the effective statistical time is from 8:00 am to 18:00 pm every day, fill in 8 and 10 respectively.
- Parameters: Click the Add Parameter button to add three parameters, namely:
- Cumulative amount (difference) of tumor on the third floor, summed by aggregation method.
- Tumor 3rd floor cumulative amount, initial value of aggregation method.
- Cumulative volume of tumor on the third floor, final value of aggregation method.
After filling in the information, click the Save button to save the data source.