Statistics of the average temperature, maximum temperature and minimum temperature of each day in the past 7 days
Scenario
This case describes how to configure the data source to display the average temperature, maximum temperature, and minimum temperature of each day for the past seven days. After the data source configuration is completed, the data is generally displayed using charts or table components.
Prerequisites
- The model has been created on the M-IoT platform;
- The temperature sensor has collected temperature data to the M-IoT platform;
Implementation steps
In Admin mode, click the Data Sources submenu under Development Management in the left menu.
⚠️ Notes:The model in this case is named demo, which contains the temperature indicator set_T. The parameter configuration is configured according to the content circled in red
This case uses device data source as an example
- Select
Device Data Source, clickAddto enter the configuration interface, and clickOKafter the configuration is completed.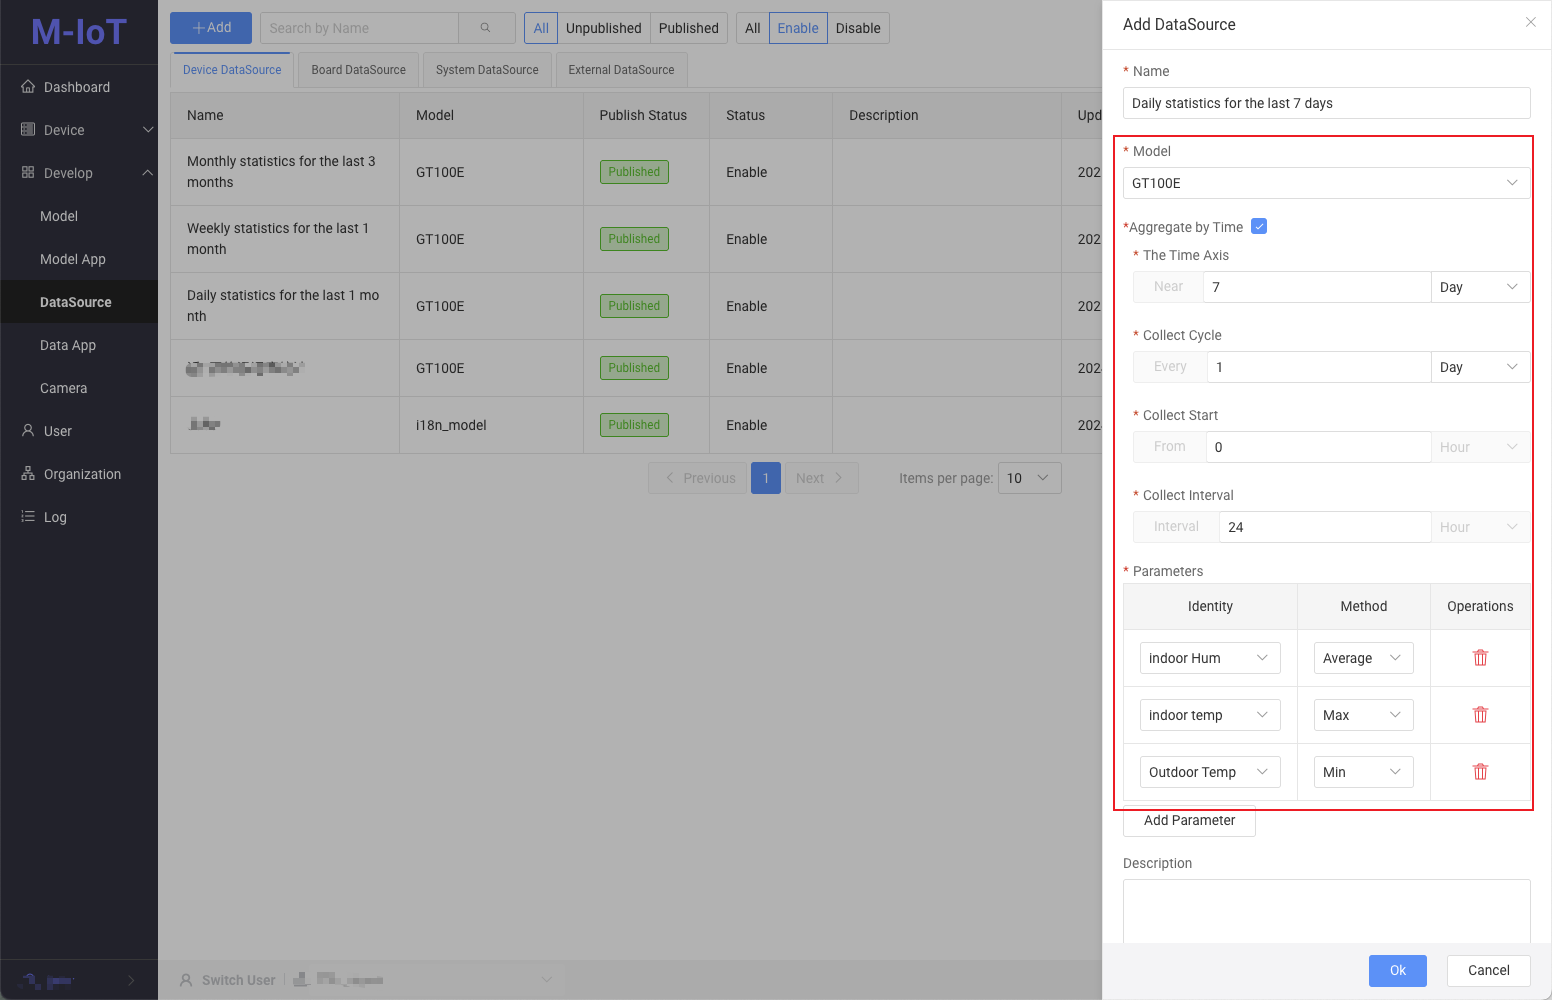
- Time dimension: Click the radio button after the time dimension to display the time dimension parameters
- Time period: Statistics for the past 7 days
- Collection cycle: once a day
- Collection start and collection interval: Count the temperature from 0:00 to 24:00 every day. Fill in according to the actual situation. For example, if the effective statistical time is from 8:00 am to 18:00 pm every day, fill in 8 and 10 respectively.
- Parameters: Click the Add Parameter button to add three parameters, namely:
- Temperature settings, aggregation mode averages.
- Temperature setting, maximum value of polymerization mode.
- Temperature setting, minimum value for polymerization mode.
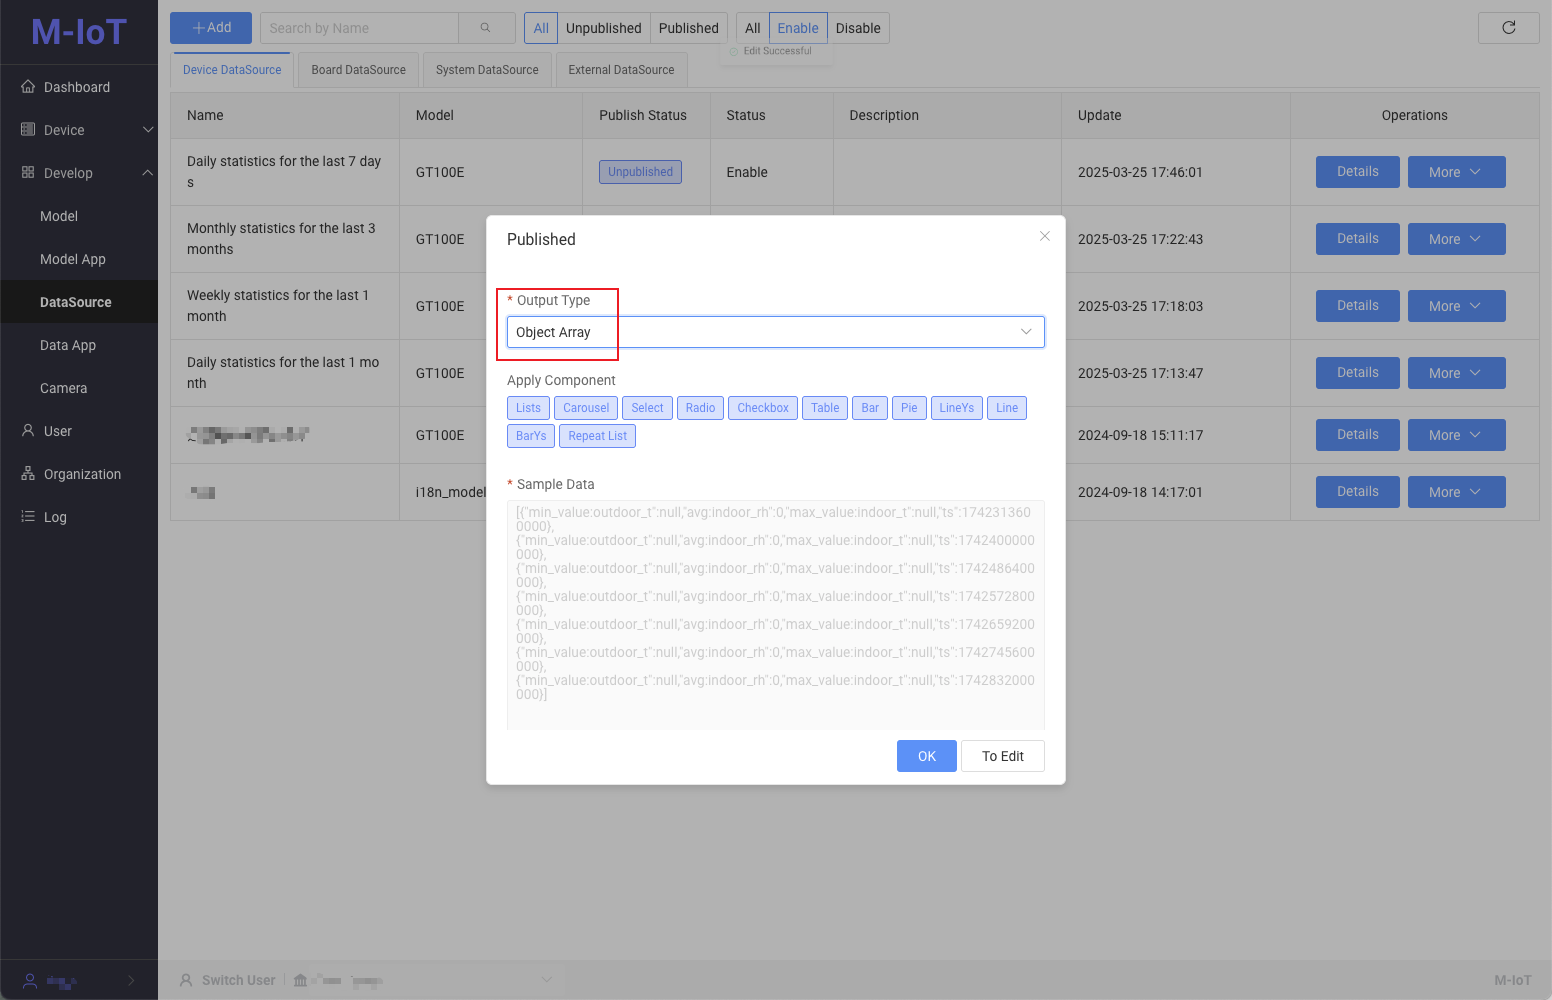
- On the data source publishing page, select Object Array for Output Type and click OK.
⚠️ The difference between Device Page and Dashboard Page is that the Dashboard Page can be configured with multiple models, while the Device Page can only be configured with one model.