Bar
The Bar component displays the trend of multiple data changes in columnar form, making it easier for you to analyze and compare data changes.This article introduces the detailed configuration method of the bar component.
Private Properties
Parameters | Description | Default value |
|---|---|---|
| Data Source | Configurable data sources | |
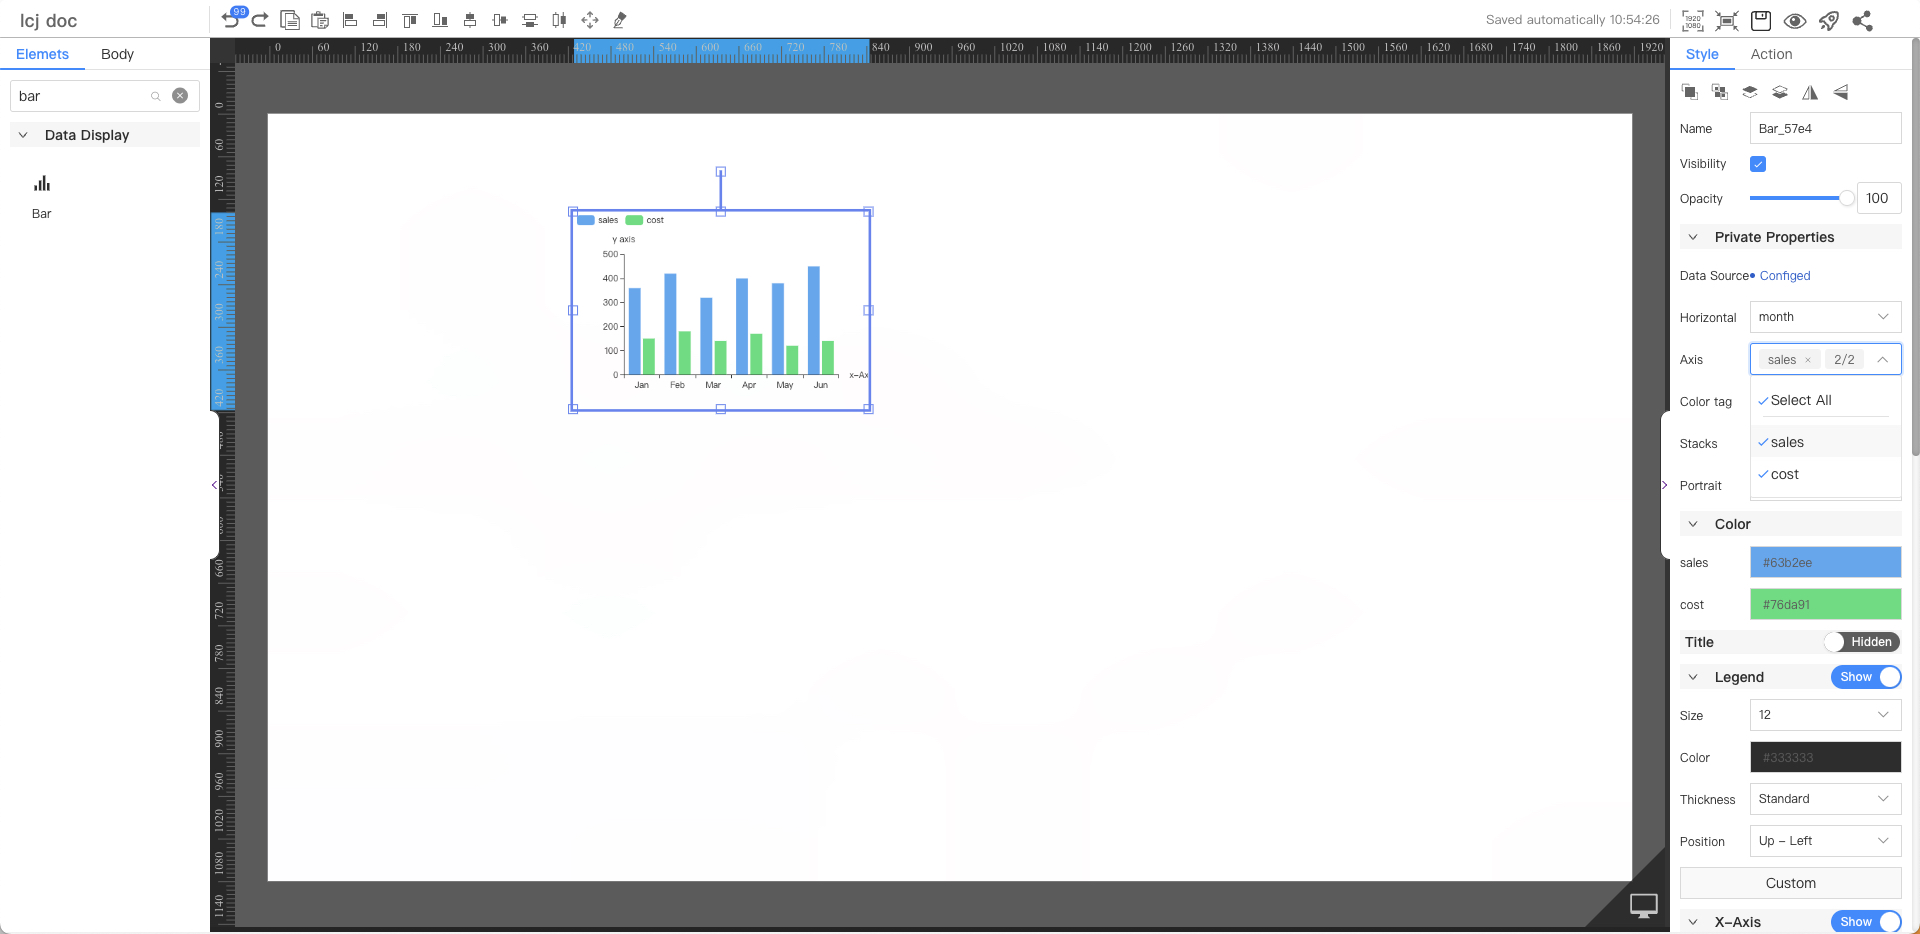
| X | ||
| Y | ||
| Color Tag | Configurable | |
| Stacks | Optional values: Yes, No | No |
| Portrait | Optional values: Yes, No | No |
Color
Column color configuration, displayed according to the vertical axis configuration
Parameters | Description | Default value |
|---|---|---|
| Vertical axis parameters | Column color of the vertical axis parameter |
Title
Not displayed by default
Parameters | Description | Default value |
|---|---|---|
| Text | ||
| Size | Optional value: 12~72 | 16 |
| Color | #333333 | |
| Thickness | Optional values: Standard, Bold | Standard |
| Position | Optional values: Right, Center, Left | Left |
| BG Color | #ffffff |
Legend
Parameters | Description | Default value |
|---|---|---|
| Size | Optional value: 12~72 | 12 |
| Color | #333333 | |
| Thickness | Optional values: Standard, Bold | Standard |
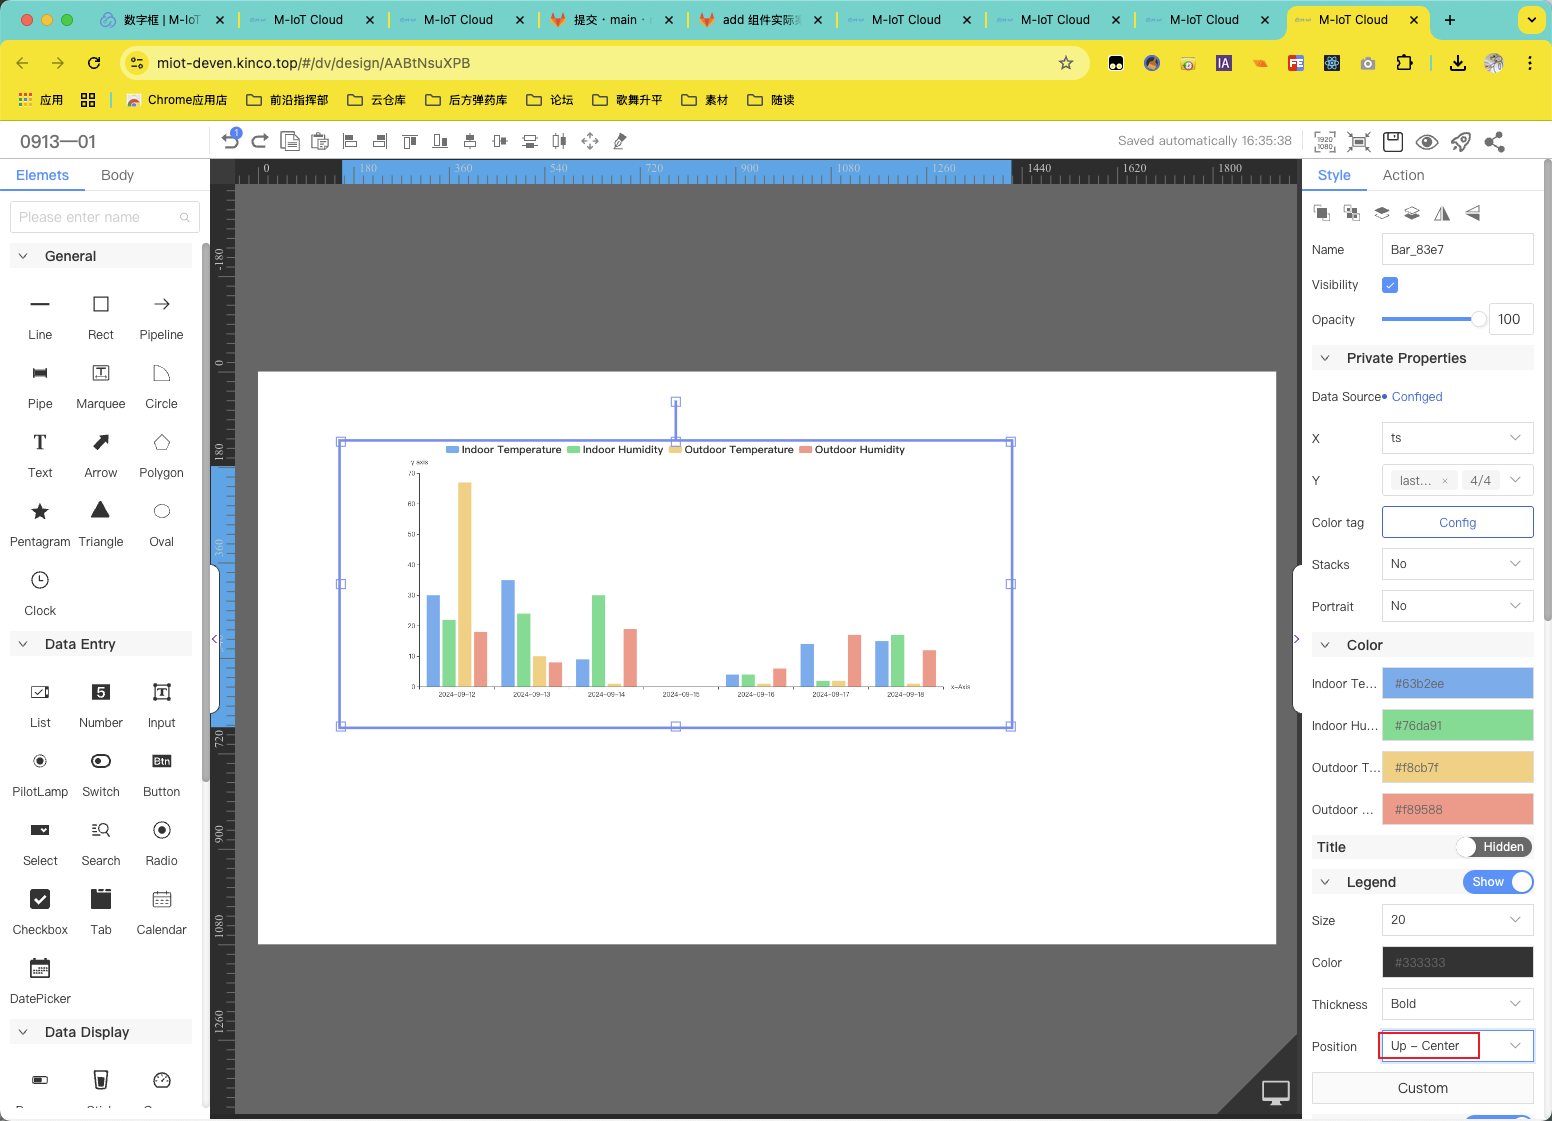
| Position | Optional values: Up-Left, Up-Center, Up-Right, Left-Up, Left-Middle, Left-Bottom, Right-Top, Right-Middle, Right-Bottom, Bottom-Left, Bottom-Center, Bottom-Right | Up-Left |
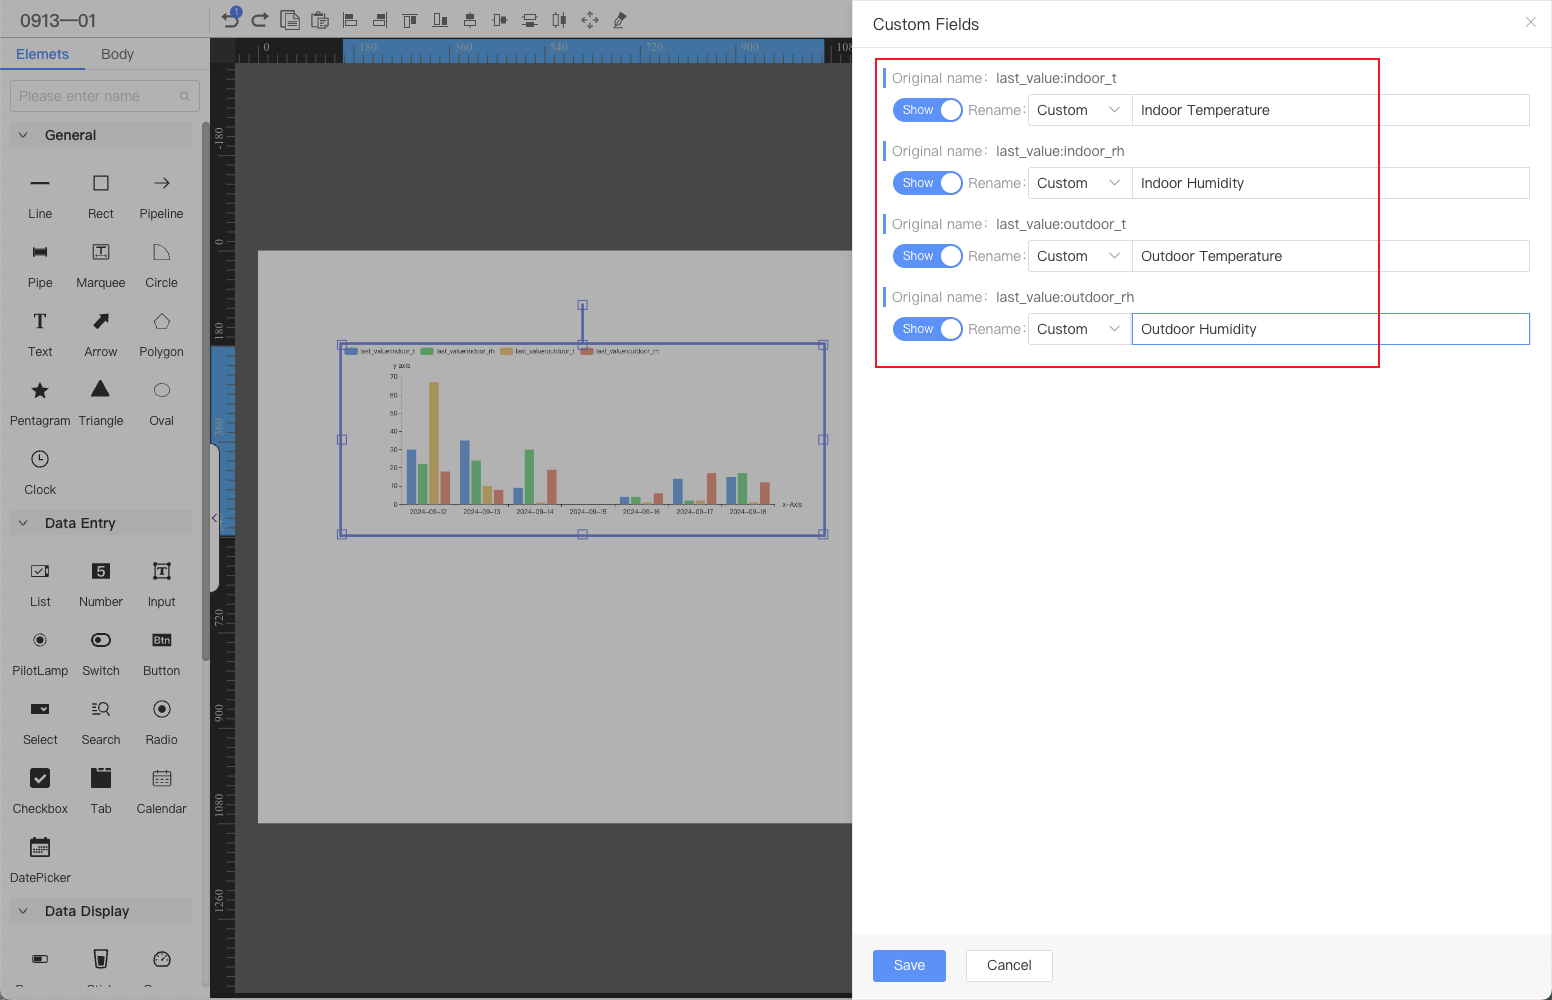
Custom
Parameters | Description | Default value |
|---|---|---|
| Source vertical axis parameters | Selected vertical axis parameters | |
| Unified/Separate Settings | Unify/separately set the vertical axis parameters | Unified |
| Show | Show/hide the vertical axis parameter bar | Show |
| Rename | Modify the text displayed on the vertical axisOptional values: Custom, Select from propertiesCustom: Fixed display of input text Select from properties:Display the value of the vertical axis parameter corresponding to the selected property | Custom |
| Attribute | Attributes corresponding to the vertical axis parameters | |
| suffix | Fixed text displayed after the attribute when displayed with "Select from Attributes" |
X-Axis
Parameters | Description | Default value |
|---|---|---|
| Name | x-Axis | |
| Size | Optional value: 12~72 | 12 |
| Color | #333333 | |
| Thickness | Optional values: Standard, Bold | Standard |
| Axis Color | #333333 | |
| Rotation | The angle shown in the subscript | 0 |
| Postfix | Fixed text to be displayed after the name |
Y-Axis
Parameters | Description | Default value |
|---|---|---|
| Name | ||
| Size | Optional value: 12~72 | 12 |
| Color | #333333 | |
| Thickness | Optional values: Standard, Bold | Standard |
| Axis Color | #333333 | |
| Rotation | The angle shown in the subscript | 0 |
| Range | Optional values: Auto Setup, Manual Setup | Auto Setup |
| Scale Up | Displayed with range Manual Setup, set the maximum scale of the Y axis in % | 0 |
| Scale Down | Displayed with range Manual Setup, set the minimum scale of the Y axis in % | 0 |
| Postfix | Fixed text to be displayed after the name |
Tag
Not displayed by default, the Y-axis value is displayed in the column
Parameters | Description | Default value |
|---|---|---|
| Position | Optional values: Top, Bottom | Top |
| Size | Optional value: 12~72 | 12 |
| Color | #333333 | |
| Thickness | Optional values: Standard, Bold | Standard |
| Axis Color | #333333 | |
| Postfix | Fixed text displayed after the value |
Grid Line
Not displayed by default
Parameters | Description | Default value |
|---|---|---|
| Thickness | 1 | |
| Color | #999999 | |
| Line Style | Optional values: solid line, dashed line, dotted line | straight line |
BG Color
Not displayed by default
Parameters | Description | Default value |
|---|---|---|
| Color | #ffffff |
Border
Not displayed by default
Parameters | Description | Default value |
|---|---|---|
| Thickness | 1 | |
| Color | #999999 | |
| Line Style | Optional values: solid line, dashed line, dotted line | straight line |
Node
Parameters | Description | Default value |
|---|---|---|
| Width | Overall width | 300 |
| Height | Overall height | 200 |
| X | Horizontal coordinate | — |
| Y | Vertical coordinate | — |
Application Examples
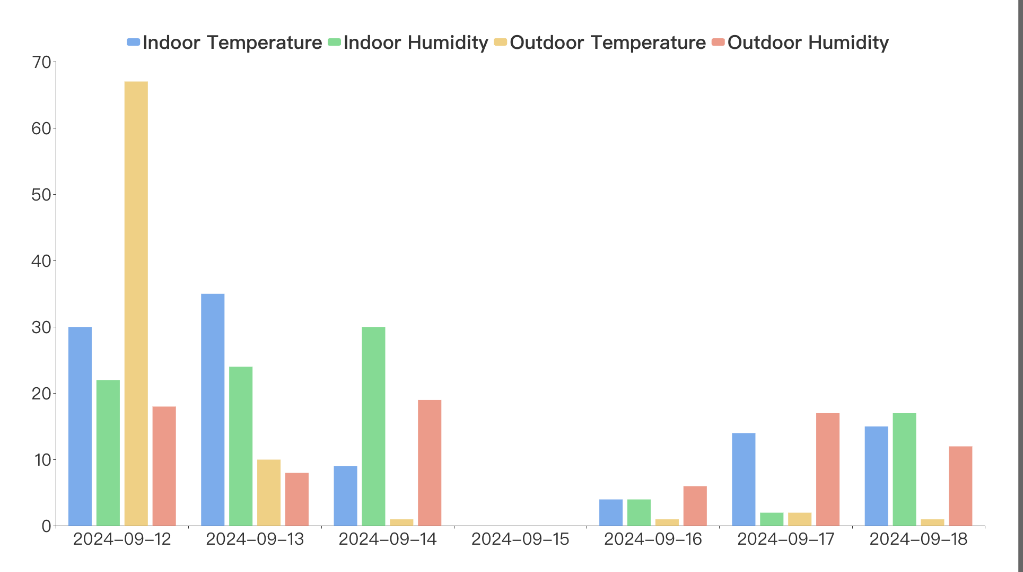
Use a bar chart to display the daily maximum temperature, minimum temperature and average temperature statistics for the past 7 days.
Step 1: Add components
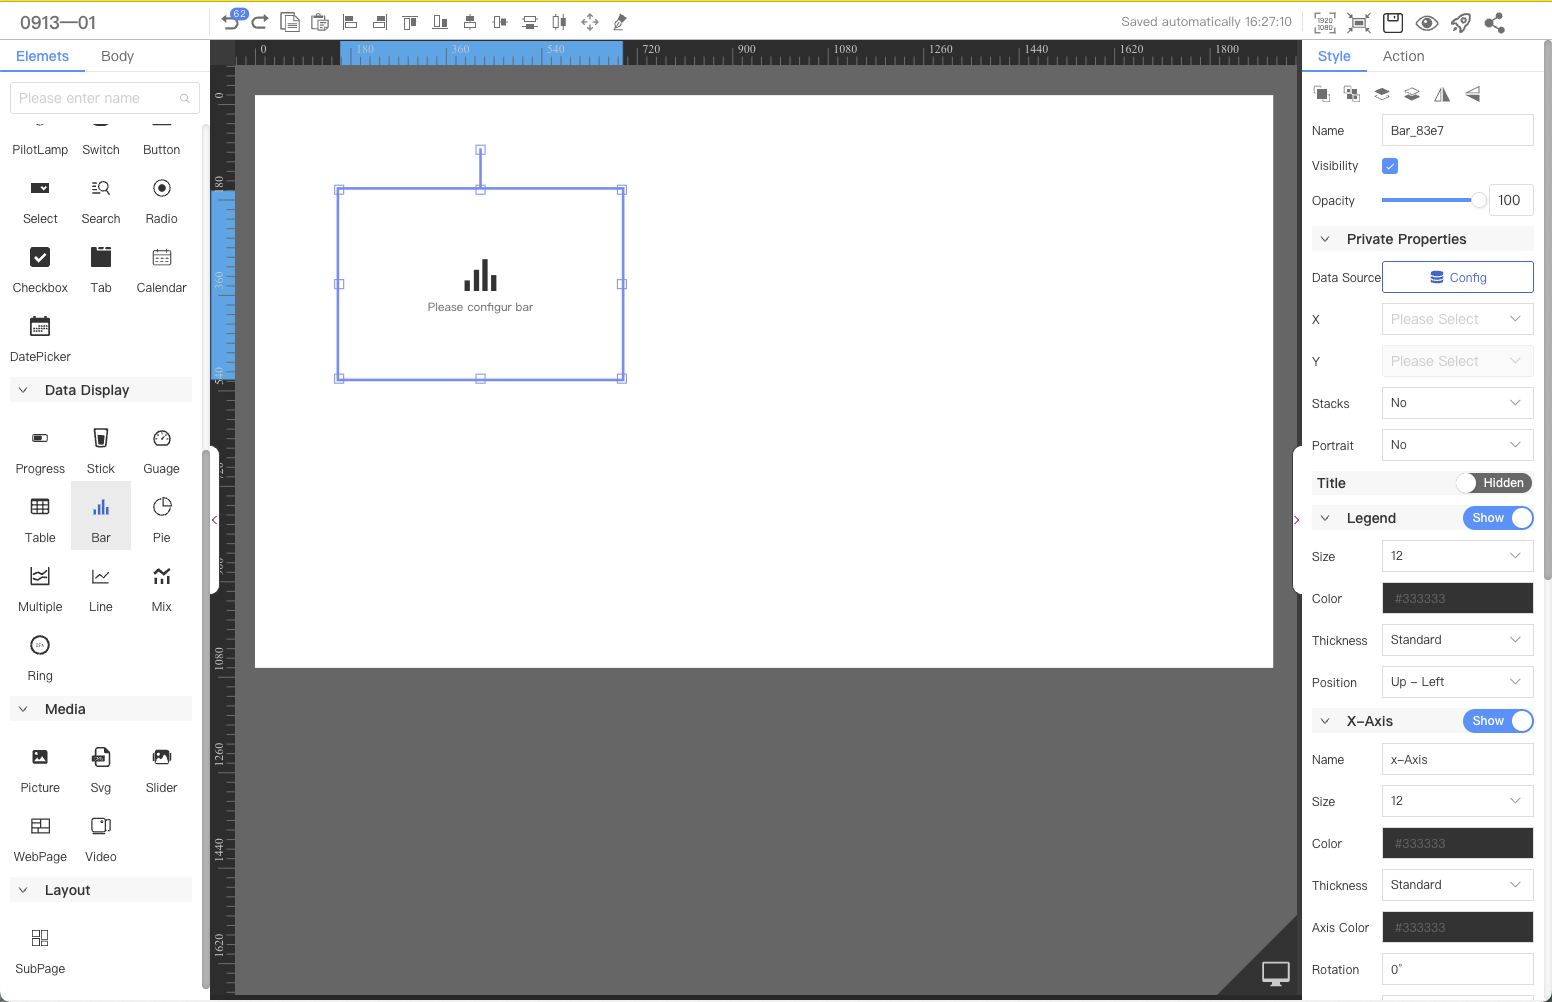
Above the component list on the left side of the canvas, enter bar chart, find the component, and then drag the component to the middle canvas.
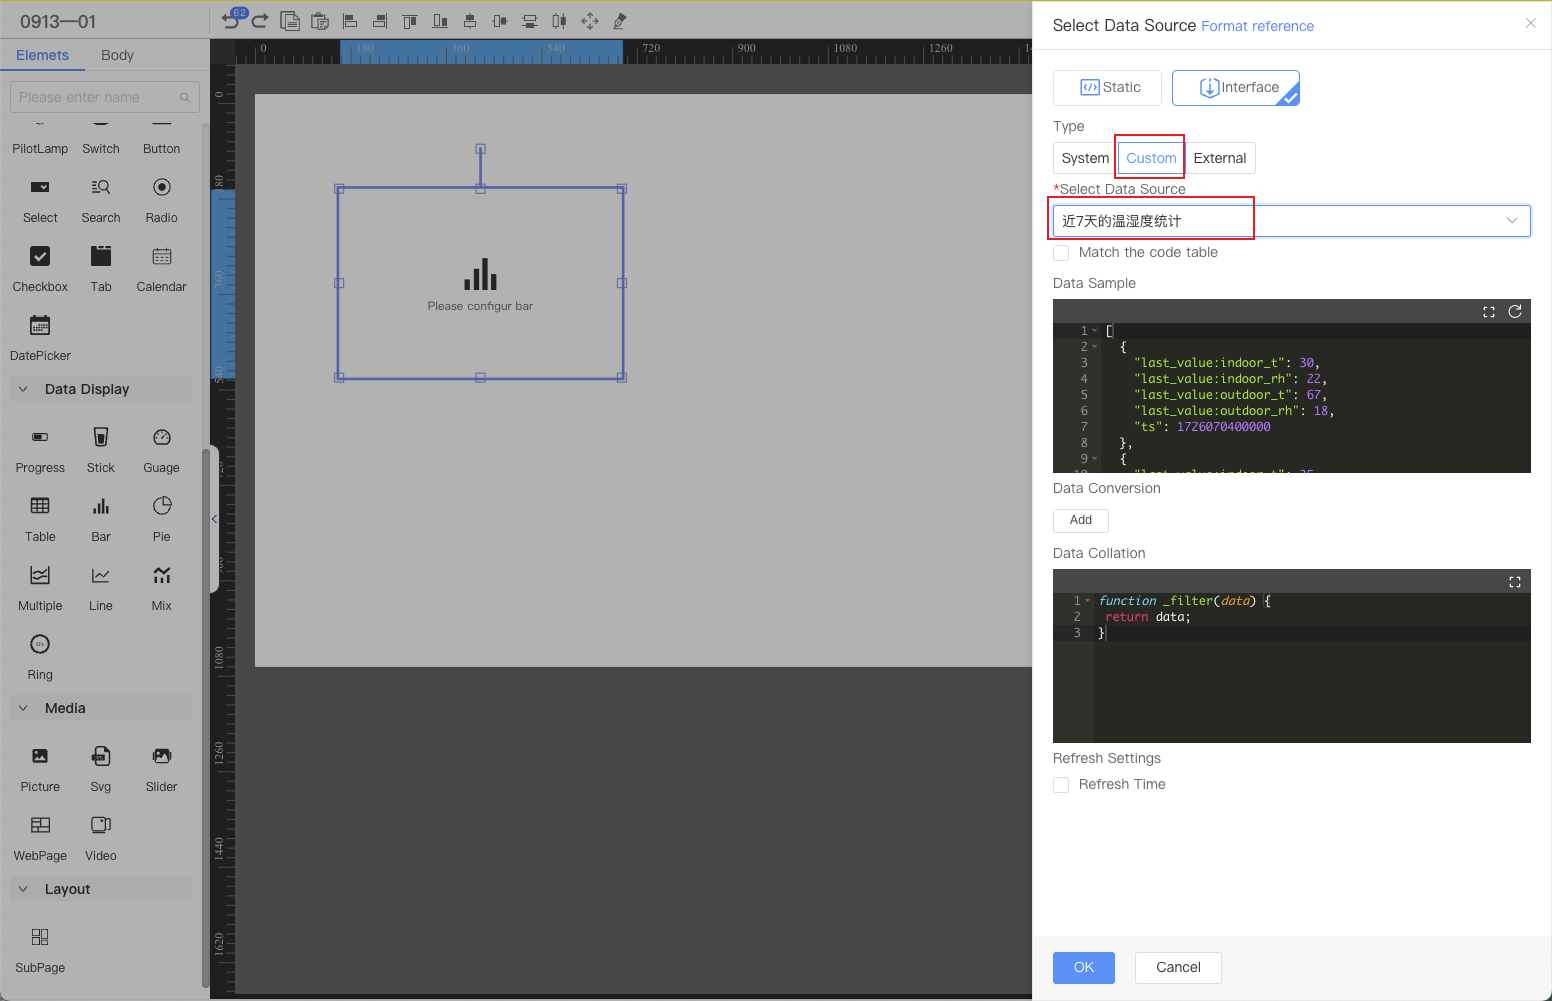
Step 2: Configure the data source
In the Web editor, select the component and click Configure Data Source in the style on the right.
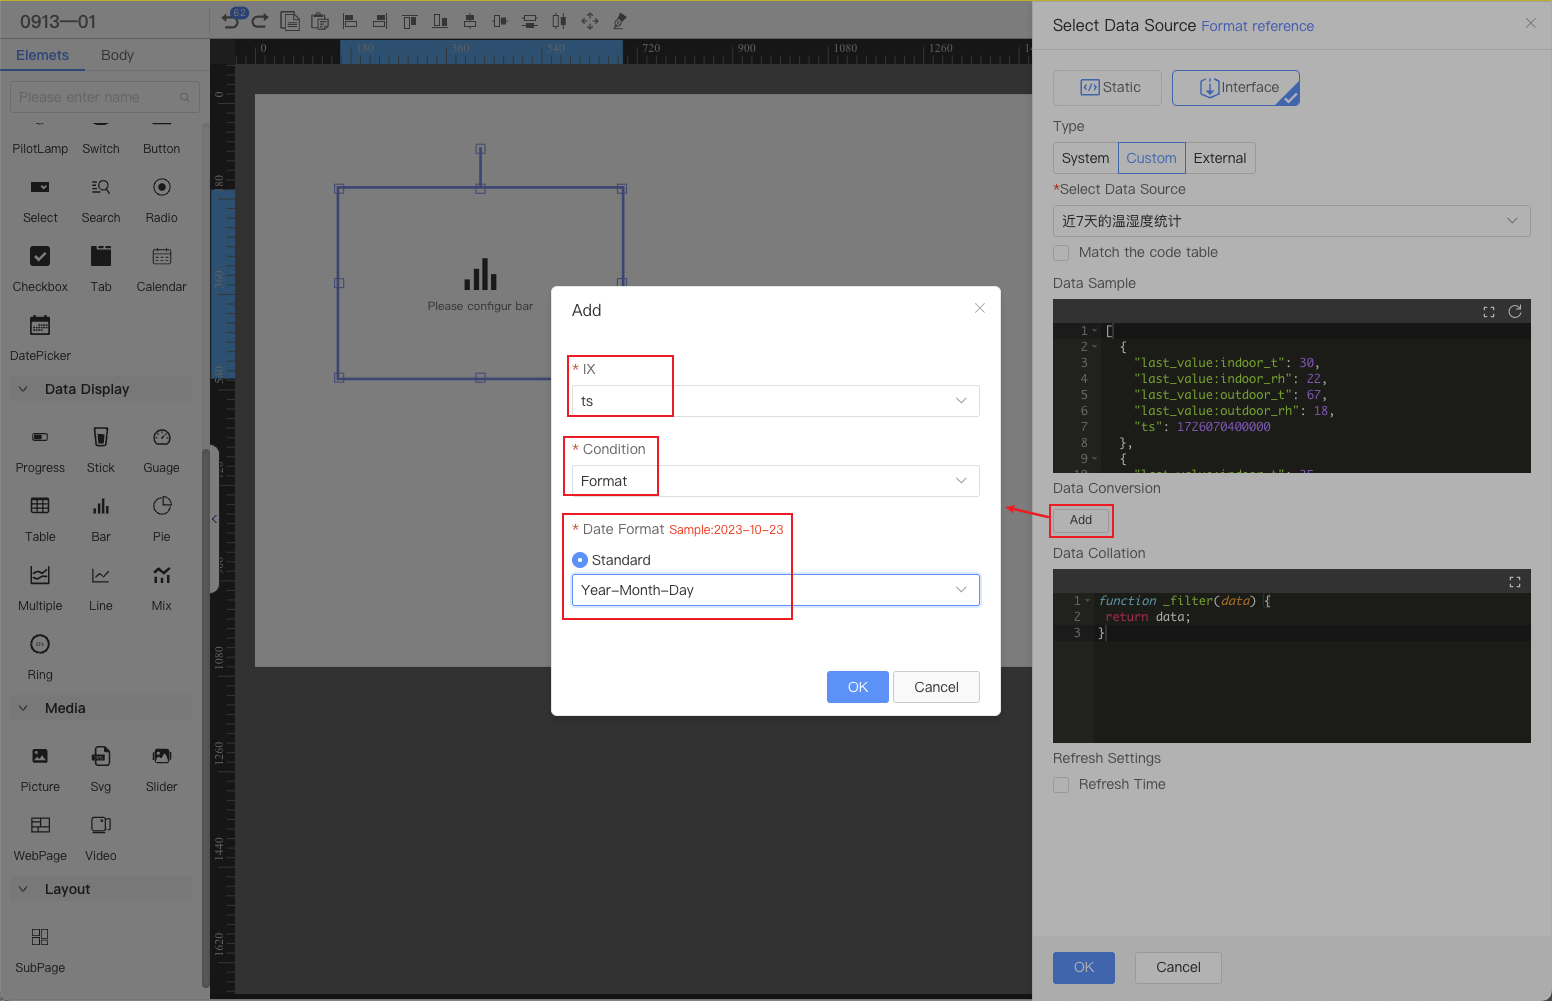
To improve display clarity, the time will be formatted as YYYY-MM-DD.
Step 3: Configure the style
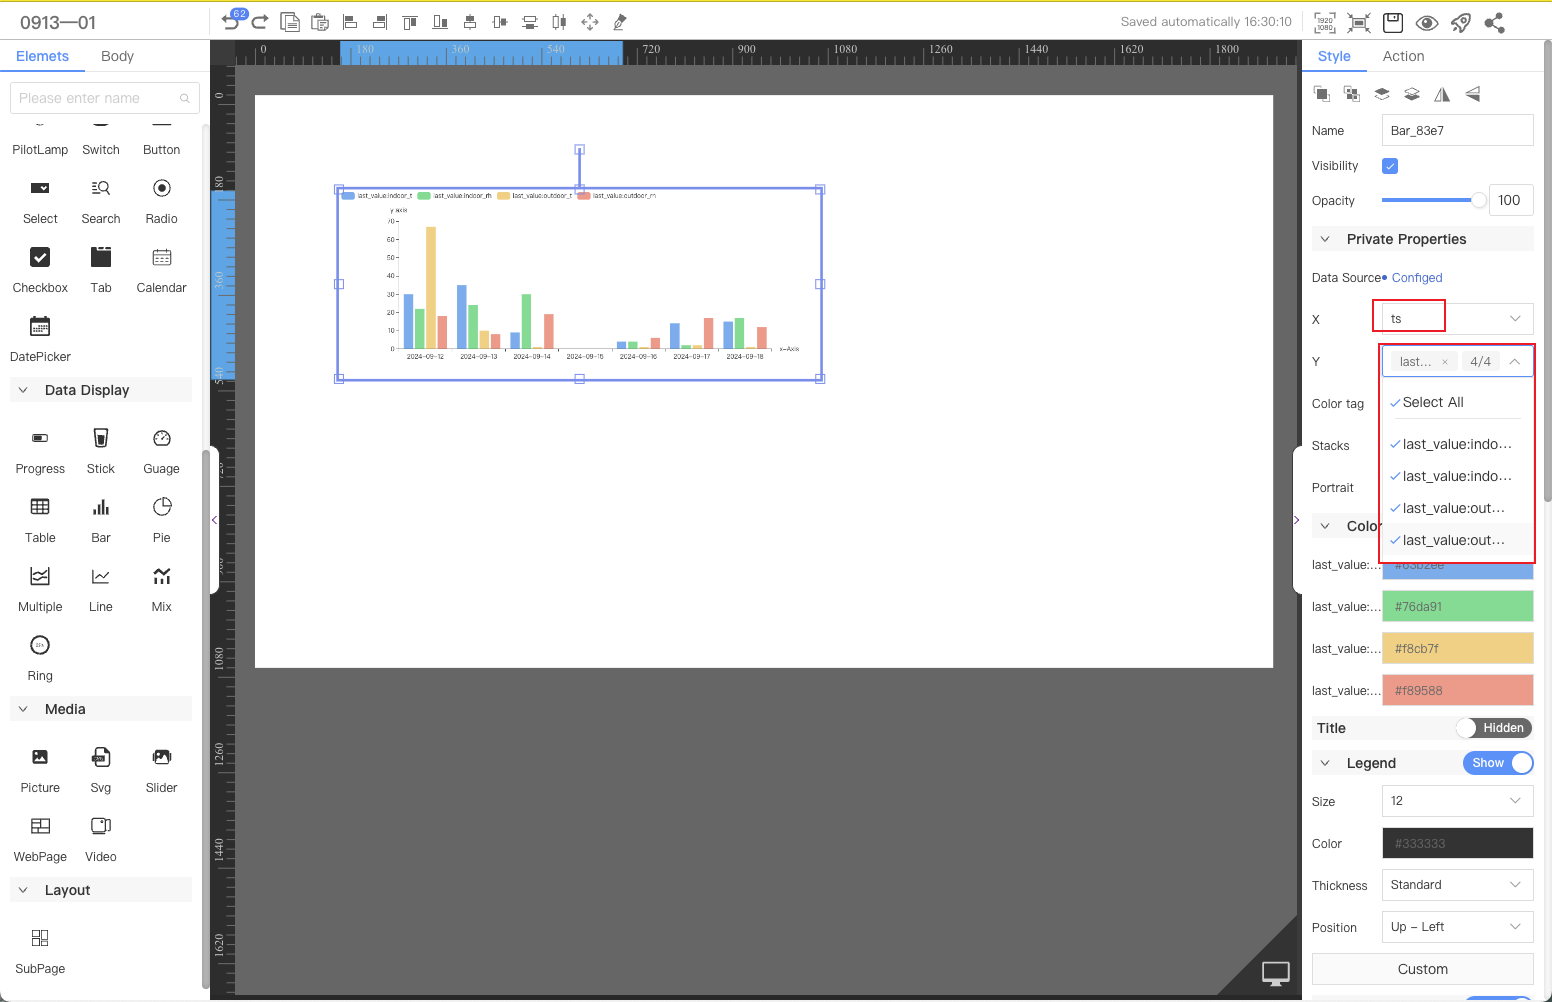
Configure the results returned by the interface as the horizontal and vertical axis data of the chart.
Modify the name of the legend
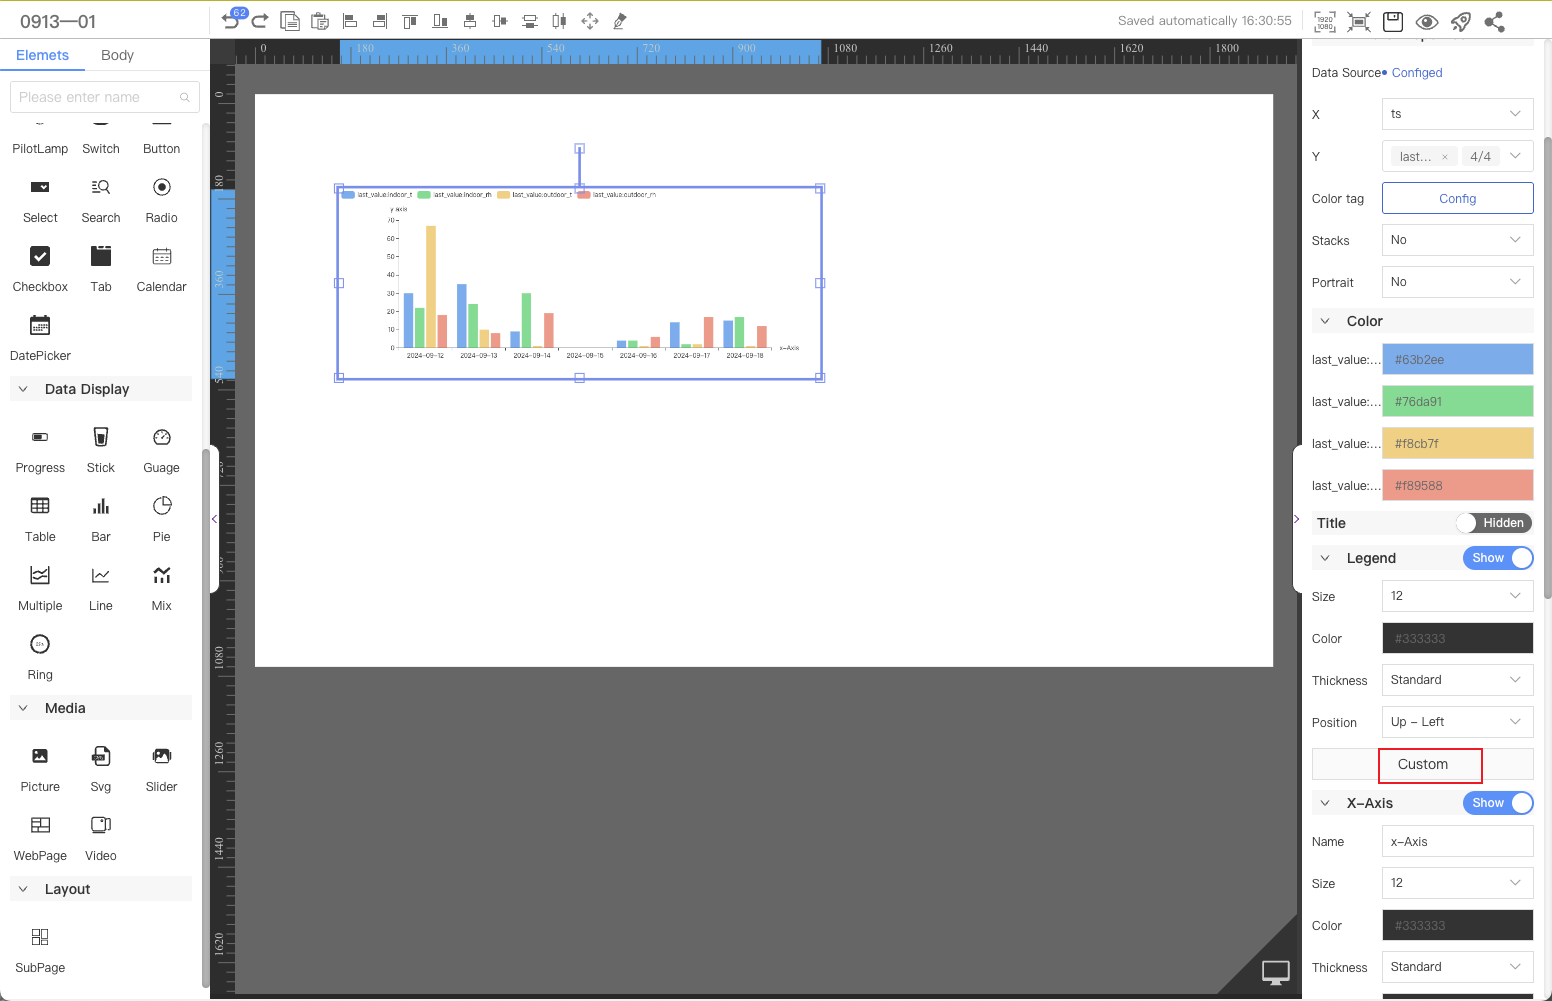
Finally, adjust the position of the legend to be centered